
Advertisement
- Hong Kong
- /
- Tech Hardware
- /
- SEHK:8111
Is China Technology Industry Group (HKG:8111) The Next Multi-Bagger?
If we want to find a stock that could multiply over the long term, what are the underlying trends we should look for? Amongst other things, we'll want to see two things; firstly, a growing return on capital employed (ROCE) and secondly, an expansion in the company's amount of capital employed. Basically this means that a company has profitable initiatives that it can continue to reinvest in, which is a trait of a compounding machine. Speaking of which, we noticed some great changes in China Technology Industry Group's (HKG:8111) returns on capital, so let's have a look.
Return On Capital Employed (ROCE): What is it?
For those who don't know, ROCE is a measure of a company's yearly pre-tax profit (its return), relative to the capital employed in the business. To calculate this metric for China Technology Industry Group, this is the formula:
Return on Capital Employed = Earnings Before Interest and Tax (EBIT) ÷ (Total Assets - Current Liabilities)
0.35 = CN¥39m ÷ (CN¥190m - CN¥77m) (Based on the trailing twelve months to September 2020).
Thus, China Technology Industry Group has an ROCE of 35%. In absolute terms that's a great return and it's even better than the Tech industry average of 6.5%.
Check out our latest analysis for China Technology Industry Group
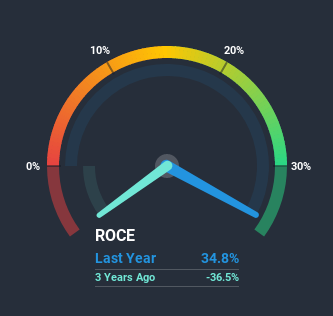
Historical performance is a great place to start when researching a stock so above you can see the gauge for China Technology Industry Group's ROCE against it's prior returns. If you're interested in investigating China Technology Industry Group's past further, check out this free graph of past earnings, revenue and cash flow.
How Are Returns Trending?
You'd find it hard not to be impressed with the ROCE trend at China Technology Industry Group. The figures show that over the last five years, returns on capital have grown by 398%. That's a very favorable trend because this means that the company is earning more per dollar of capital that's being employed. Speaking of capital employed, the company is actually utilizing 64% less than it was five years ago, which can be indicative of a business that's improving its efficiency. A business that's shrinking its asset base like this isn't usually typical of a soon to be multi-bagger company.
On a side note, we noticed that the improvement in ROCE appears to be partly fueled by an increase in current liabilities. Effectively this means that suppliers or short-term creditors are now funding 41% of the business, which is more than it was five years ago. And with current liabilities at those levels, that's pretty high.The Key Takeaway
In a nutshell, we're pleased to see that China Technology Industry Group has been able to generate higher returns from less capital. Given the stock has declined 36% in the last five years, this could be a good investment if the valuation and other metrics are also appealing. With that in mind, we believe the promising trends warrant this stock for further investigation.
China Technology Industry Group does have some risks though, and we've spotted 4 warning signs for China Technology Industry Group that you might be interested in.
If you want to search for more stocks that have been earning high returns, check out this free list of stocks with solid balance sheets that are also earning high returns on equity.
When trading China Technology Industry Group or any other investment, use the platform considered by many to be the Professional's Gateway to the Worlds Market, Interactive Brokers. You get the lowest-cost* trading on stocks, options, futures, forex, bonds and funds worldwide from a single integrated account. Promoted
New: AI Stock Screener & Alerts
Our new AI Stock Screener scans the market every day to uncover opportunities.
• Dividend Powerhouses (3%+ Yield)
• Undervalued Small Caps with Insider Buying
• High growth Tech and AI Companies
Or build your own from over 50 metrics.
This article by Simply Wall St is general in nature. It does not constitute a recommendation to buy or sell any stock, and does not take account of your objectives, or your financial situation. We aim to bring you long-term focused analysis driven by fundamental data. Note that our analysis may not factor in the latest price-sensitive company announcements or qualitative material. Simply Wall St has no position in any stocks mentioned.
*Interactive Brokers Rated Lowest Cost Broker by StockBrokers.com Annual Online Review 2020
Have feedback on this article? Concerned about the content? Get in touch with us directly. Alternatively, email editorial-team@simplywallst.com.
About SEHK:8111
China Technology Industry Group
An investment holding company, engages in the sales of the renewable energy products business and new energy power system integration and electricity business in Hong Kong.
Adequate balance sheet with slight risk.
Market Insights

Advertisement
Community Narratives
MicroVision will explode future revenue by 380.37% with a vision towards success
Fair Value US$60.00|98.5% undervalued
TH
Community Contributor
The Indispensable Artery for a New North American Economy
Fair Value CA$132.87|2.3% undervalued
TI
Community Contributor