
Advertisement
- Hong Kong
- /
- Electronic Equipment and Components
- /
- SEHK:6088
The Returns On Capital At FIT Hon Teng (HKG:6088) Don't Inspire Confidence
There are a few key trends to look for if we want to identify the next multi-bagger. Ideally, a business will show two trends; firstly a growing return on capital employed (ROCE) and secondly, an increasing amount of capital employed. This shows us that it's a compounding machine, able to continually reinvest its earnings back into the business and generate higher returns. Although, when we looked at FIT Hon Teng (HKG:6088), it didn't seem to tick all of these boxes.
Understanding Return On Capital Employed (ROCE)
For those that aren't sure what ROCE is, it measures the amount of pre-tax profits a company can generate from the capital employed in its business. The formula for this calculation on FIT Hon Teng is:
Return on Capital Employed = Earnings Before Interest and Tax (EBIT) ÷ (Total Assets - Current Liabilities)
0.041 = US$127m ÷ (US$5.0b - US$1.9b) (Based on the trailing twelve months to December 2021).
Therefore, FIT Hon Teng has an ROCE of 4.1%. Ultimately, that's a low return and it under-performs the Electronic industry average of 6.3%.
View our latest analysis for FIT Hon Teng
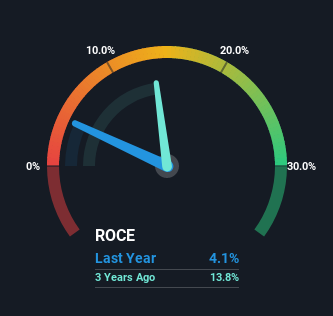
Above you can see how the current ROCE for FIT Hon Teng compares to its prior returns on capital, but there's only so much you can tell from the past. If you're interested, you can view the analysts predictions in our free report on analyst forecasts for the company.
The Trend Of ROCE
When we looked at the ROCE trend at FIT Hon Teng, we didn't gain much confidence. Over the last five years, returns on capital have decreased to 4.1% from 14% five years ago. However it looks like FIT Hon Teng might be reinvesting for long term growth because while capital employed has increased, the company's sales haven't changed much in the last 12 months. It's worth keeping an eye on the company's earnings from here on to see if these investments do end up contributing to the bottom line.
On a side note, FIT Hon Teng has done well to pay down its current liabilities to 39% of total assets. So we could link some of this to the decrease in ROCE. What's more, this can reduce some aspects of risk to the business because now the company's suppliers or short-term creditors are funding less of its operations. Since the business is basically funding more of its operations with it's own money, you could argue this has made the business less efficient at generating ROCE.
The Bottom Line On FIT Hon Teng's ROCE
To conclude, we've found that FIT Hon Teng is reinvesting in the business, but returns have been falling. Moreover, since the stock has crumbled 73% over the last five years, it appears investors are expecting the worst. On the whole, we aren't too inspired by the underlying trends and we think there may be better chances of finding a multi-bagger elsewhere.
FIT Hon Teng does have some risks though, and we've spotted 3 warning signs for FIT Hon Teng that you might be interested in.
While FIT Hon Teng isn't earning the highest return, check out this free list of companies that are earning high returns on equity with solid balance sheets.
New: AI Stock Screener & Alerts
Our new AI Stock Screener scans the market every day to uncover opportunities.
• Dividend Powerhouses (3%+ Yield)
• Undervalued Small Caps with Insider Buying
• High growth Tech and AI Companies
Or build your own from over 50 metrics.
Have feedback on this article? Concerned about the content? Get in touch with us directly. Alternatively, email editorial-team (at) simplywallst.com.
This article by Simply Wall St is general in nature. We provide commentary based on historical data and analyst forecasts only using an unbiased methodology and our articles are not intended to be financial advice. It does not constitute a recommendation to buy or sell any stock, and does not take account of your objectives, or your financial situation. We aim to bring you long-term focused analysis driven by fundamental data. Note that our analysis may not factor in the latest price-sensitive company announcements or qualitative material. Simply Wall St has no position in any stocks mentioned.
About SEHK:6088
FIT Hon Teng
Manufactures and sells mobile and wireless devices and connectors in Taiwan and internationally.
Excellent balance sheet with reasonable growth potential.
Similar Companies
Market Insights

Advertisement
Community Narratives
MicroVision will explode future revenue by 380.37% with a vision towards success
Fair Value US$60.00|98.4% undervalued
TH
Community Contributor
The Indispensable Artery for a New North American Economy
Fair Value CA$132.87|1.3% undervalued
TI
Community Contributor