
Advertisement
- Hong Kong
- /
- Tech Hardware
- /
- SEHK:3396
An Intrinsic Calculation For Legend Holdings Corporation (HKG:3396) Suggests It's 40% Undervalued
Key Insights
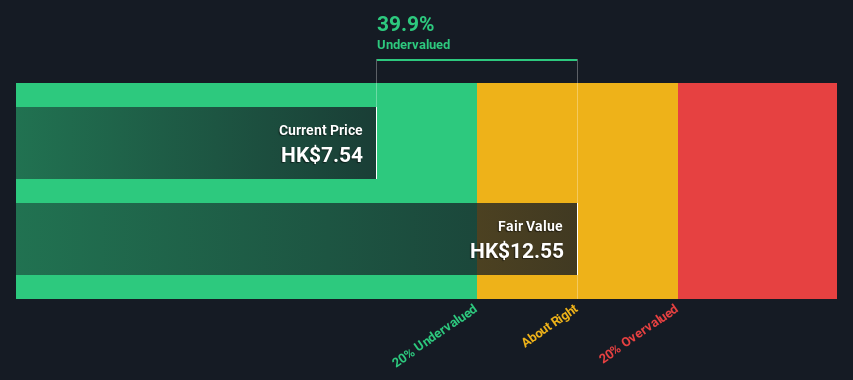
- Using the 2 Stage Free Cash Flow to Equity, Legend Holdings fair value estimate is HK$12.55
- Legend Holdings is estimated to be 40% undervalued based on current share price of HK$7.54
- Industry average discount to fair value of 22% suggests Legend Holdings' peers are currently trading at a lower discount
Today we will run through one way of estimating the intrinsic value of Legend Holdings Corporation (HKG:3396) by estimating the company's future cash flows and discounting them to their present value. Our analysis will employ the Discounted Cash Flow (DCF) model. Models like these may appear beyond the comprehension of a lay person, but they're fairly easy to follow.
Companies can be valued in a lot of ways, so we would point out that a DCF is not perfect for every situation. Anyone interested in learning a bit more about intrinsic value should have a read of the Simply Wall St analysis model.
Our free stock report includes 1 warning sign investors should be aware of before investing in Legend Holdings. Read for free now.What's The Estimated Valuation?
We are going to use a two-stage DCF model, which, as the name states, takes into account two stages of growth. The first stage is generally a higher growth period which levels off heading towards the terminal value, captured in the second 'steady growth' period. In the first stage we need to estimate the cash flows to the business over the next ten years. Seeing as no analyst estimates of free cash flow are available to us, we have extrapolate the previous free cash flow (FCF) from the company's last reported value. We assume companies with shrinking free cash flow will slow their rate of shrinkage, and that companies with growing free cash flow will see their growth rate slow, over this period. We do this to reflect that growth tends to slow more in the early years than it does in later years.
Generally we assume that a dollar today is more valuable than a dollar in the future, and so the sum of these future cash flows is then discounted to today's value:
10-year free cash flow (FCF) estimate
| 2025 | 2026 | 2027 | 2028 | 2029 | 2030 | 2031 | 2032 | 2033 | 2034 | |
| Levered FCF (CN¥, Millions) | CN¥6.61b | CN¥4.58b | CN¥3.63b | CN¥3.13b | CN¥2.85b | CN¥2.69b | CN¥2.61b | CN¥2.57b | CN¥2.56b | CN¥2.57b |
| Growth Rate Estimate Source | Est @ -44.96% | Est @ -30.74% | Est @ -20.79% | Est @ -13.82% | Est @ -8.94% | Est @ -5.53% | Est @ -3.14% | Est @ -1.46% | Est @ -0.29% | Est @ 0.53% |
| Present Value (CN¥, Millions) Discounted @ 13% | CN¥5.9k | CN¥3.6k | CN¥2.5k | CN¥1.9k | CN¥1.5k | CN¥1.3k | CN¥1.1k | CN¥967 | CN¥854 | CN¥759 |
("Est" = FCF growth rate estimated by Simply Wall St)
Present Value of 10-year Cash Flow (PVCF) = CN¥20b
We now need to calculate the Terminal Value, which accounts for all the future cash flows after this ten year period. For a number of reasons a very conservative growth rate is used that cannot exceed that of a country's GDP growth. In this case we have used the 5-year average of the 10-year government bond yield (2.4%) to estimate future growth. In the same way as with the 10-year 'growth' period, we discount future cash flows to today's value, using a cost of equity of 13%.
Terminal Value (TV)= FCF2034 × (1 + g) ÷ (r – g) = CN¥2.6b× (1 + 2.4%) ÷ (13%– 2.4%) = CN¥25b
Present Value of Terminal Value (PVTV)= TV / (1 + r)10= CN¥25b÷ ( 1 + 13%)10= CN¥7.4b
The total value is the sum of cash flows for the next ten years plus the discounted terminal value, which results in the Total Equity Value, which in this case is CN¥28b. To get the intrinsic value per share, we divide this by the total number of shares outstanding. Compared to the current share price of HK$7.5, the company appears quite undervalued at a 40% discount to where the stock price trades currently. Remember though, that this is just an approximate valuation, and like any complex formula - garbage in, garbage out.
Important Assumptions
The calculation above is very dependent on two assumptions. The first is the discount rate and the other is the cash flows. Part of investing is coming up with your own evaluation of a company's future performance, so try the calculation yourself and check your own assumptions. The DCF also does not consider the possible cyclicality of an industry, or a company's future capital requirements, so it does not give a full picture of a company's potential performance. Given that we are looking at Legend Holdings as potential shareholders, the cost of equity is used as the discount rate, rather than the cost of capital (or weighted average cost of capital, WACC) which accounts for debt. In this calculation we've used 13%, which is based on a levered beta of 2.000. Beta is a measure of a stock's volatility, compared to the market as a whole. We get our beta from the industry average beta of globally comparable companies, with an imposed limit between 0.8 and 2.0, which is a reasonable range for a stable business.
View our latest analysis for Legend Holdings
SWOT Analysis for Legend Holdings
Strength
- No major strengths identified for 3396.
Weakness
- Interest payments on debt are not well covered.
Opportunity
- Annual earnings are forecast to grow faster than the Hong Kong market.
- Trading below our estimate of fair value by more than 20%.
Threat
- Debt is not well covered by operating cash flow.
Next Steps:
Although the valuation of a company is important, it is only one of many factors that you need to assess for a company. The DCF model is not a perfect stock valuation tool. Preferably you'd apply different cases and assumptions and see how they would impact the company's valuation. For example, changes in the company's cost of equity or the risk free rate can significantly impact the valuation. What is the reason for the share price sitting below the intrinsic value? For Legend Holdings, we've put together three relevant aspects you should further research:
- Risks: To that end, you should be aware of the 1 warning sign we've spotted with Legend Holdings .
- Future Earnings: How does 3396's growth rate compare to its peers and the wider market? Dig deeper into the analyst consensus number for the upcoming years by interacting with our free analyst growth expectation chart.
- Other Solid Businesses: Low debt, high returns on equity and good past performance are fundamental to a strong business. Why not explore our interactive list of stocks with solid business fundamentals to see if there are other companies you may not have considered!
PS. Simply Wall St updates its DCF calculation for every Hong Kong stock every day, so if you want to find the intrinsic value of any other stock just search here.
New: AI Stock Screener & Alerts
Our new AI Stock Screener scans the market every day to uncover opportunities.
• Dividend Powerhouses (3%+ Yield)
• Undervalued Small Caps with Insider Buying
• High growth Tech and AI Companies
Or build your own from over 50 metrics.
Have feedback on this article? Concerned about the content? Get in touch with us directly. Alternatively, email editorial-team (at) simplywallst.com.
This article by Simply Wall St is general in nature. We provide commentary based on historical data and analyst forecasts only using an unbiased methodology and our articles are not intended to be financial advice. It does not constitute a recommendation to buy or sell any stock, and does not take account of your objectives, or your financial situation. We aim to bring you long-term focused analysis driven by fundamental data. Note that our analysis may not factor in the latest price-sensitive company announcements or qualitative material. Simply Wall St has no position in any stocks mentioned.
About SEHK:3396
Legend Holdings
Legend Holdings Corporation, along with its subsidiaries, operates in the industrial operations and industrial incubations and investments sectors in the People’s Republic of China and internationally.
Moderate growth potential with questionable track record.
Market Insights

Advertisement
Community Narratives
MicroVision will explode future revenue by 380.37% with a vision towards success
Fair Value US$60.00|98.4% undervalued
TH
Community Contributor
The Indispensable Artery for a New North American Economy
Fair Value CA$132.87|1.3% undervalued
TI
Community Contributor