- Hong Kong
- /
- Electronic Equipment and Components
- /
- SEHK:3336
Investors in Ju Teng International Holdings (HKG:3336) from five years ago are still down 21%, even after 12% gain this past week

Ju Teng International Holdings Limited (HKG:3336) shareholders should be happy to see the share price up 14% in the last month. But if you look at the last five years the returns have not been good. You would have done a lot better buying an index fund, since the stock has dropped 35% in that half decade.
Although the past week has been more reassuring for shareholders, they're still in the red over the last five years, so let's see if the underlying business has been responsible for the decline.
Check out our latest analysis for Ju Teng International Holdings
To paraphrase Benjamin Graham: Over the short term the market is a voting machine, but over the long term it's a weighing machine. One way to examine how market sentiment has changed over time is to look at the interaction between a company's share price and its earnings per share (EPS).
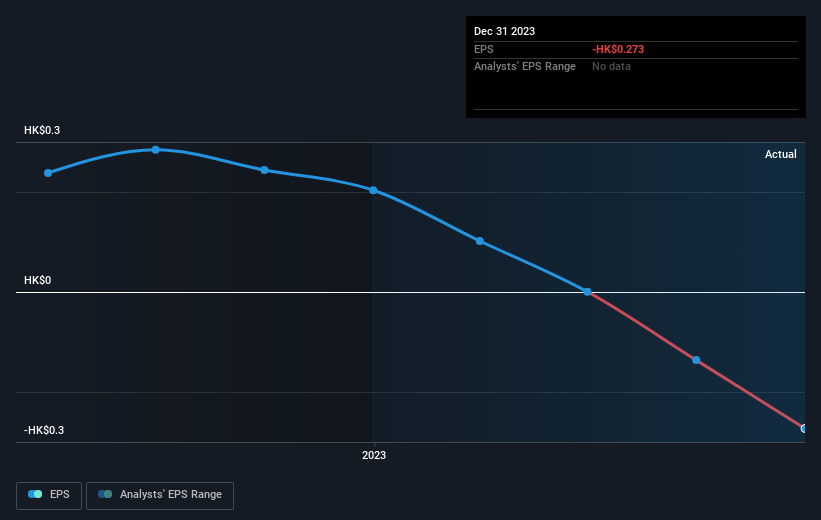
In the last half decade Ju Teng International Holdings saw its share price fall as its EPS declined below zero. Since the company has fallen to a loss making position, it's hard to compare the change in EPS with the share price change. But we would generally expect a lower price, given the situation.
The image below shows how EPS has tracked over time (if you click on the image you can see greater detail).
It's probably worth noting that the CEO is paid less than the median at similar sized companies. But while CEO remuneration is always worth checking, the really important question is whether the company can grow earnings going forward. Before buying or selling a stock, we always recommend a close examination of historic growth trends, available here..
What About The Total Shareholder Return (TSR)?
We've already covered Ju Teng International Holdings' share price action, but we should also mention its total shareholder return (TSR). The TSR is a return calculation that accounts for the value of cash dividends (assuming that any dividend received was reinvested) and the calculated value of any discounted capital raisings and spin-offs. Its history of dividend payouts mean that Ju Teng International Holdings' TSR, which was a 21% drop over the last 5 years, was not as bad as the share price return.
A Different Perspective
Investors in Ju Teng International Holdings had a tough year, with a total loss of 12%, against a market gain of about 1.1%. However, keep in mind that even the best stocks will sometimes underperform the market over a twelve month period. Regrettably, last year's performance caps off a bad run, with the shareholders facing a total loss of 4% per year over five years. Generally speaking long term share price weakness can be a bad sign, though contrarian investors might want to research the stock in hope of a turnaround. I find it very interesting to look at share price over the long term as a proxy for business performance. But to truly gain insight, we need to consider other information, too. Take risks, for example - Ju Teng International Holdings has 1 warning sign we think you should be aware of.
But note: Ju Teng International Holdings may not be the best stock to buy. So take a peek at this free list of interesting companies with past earnings growth (and further growth forecast).
Please note, the market returns quoted in this article reflect the market weighted average returns of stocks that currently trade on Hong Kong exchanges.
New: Manage All Your Stock Portfolios in One Place
We've created the ultimate portfolio companion for stock investors, and it's free.
• Connect an unlimited number of Portfolios and see your total in one currency
• Be alerted to new Warning Signs or Risks via email or mobile
• Track the Fair Value of your stocks
Have feedback on this article? Concerned about the content? Get in touch with us directly. Alternatively, email editorial-team (at) simplywallst.com.
This article by Simply Wall St is general in nature. We provide commentary based on historical data and analyst forecasts only using an unbiased methodology and our articles are not intended to be financial advice. It does not constitute a recommendation to buy or sell any stock, and does not take account of your objectives, or your financial situation. We aim to bring you long-term focused analysis driven by fundamental data. Note that our analysis may not factor in the latest price-sensitive company announcements or qualitative material. Simply Wall St has no position in any stocks mentioned.
Have feedback on this article? Concerned about the content? Get in touch with us directly. Alternatively, email editorial-team@simplywallst.com
About SEHK:3336
Ju Teng International Holdings
An investment holding company, manufactures and sells casings for notebook computer and handheld devices in the People’s Republic of China and internationally.
Excellent balance sheet and slightly overvalued.

