
Advertisement
- Hong Kong
- /
- Electronic Equipment and Components
- /
- SEHK:2323
Renco Holdings Group Limited (HKG:2323) Stock Rockets 38% But Many Are Still Ignoring The Company
Those holding Renco Holdings Group Limited (HKG:2323) shares would be relieved that the share price has rebounded 38% in the last thirty days, but it needs to keep going to repair the recent damage it has caused to investor portfolios. Not all shareholders will be feeling jubilant, since the share price is still down a very disappointing 49% in the last twelve months.
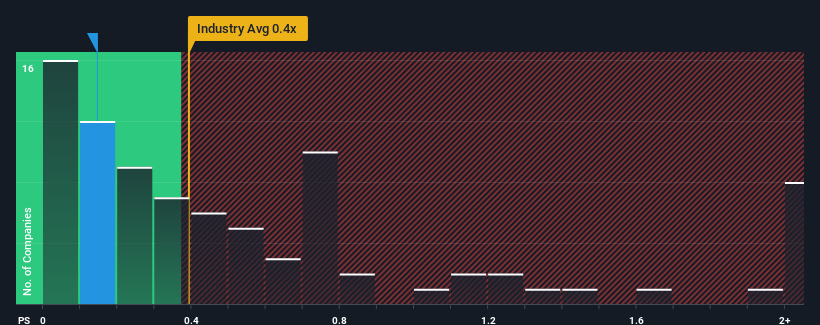
In spite of the firm bounce in price, it's still not a stretch to say that Renco Holdings Group's price-to-sales (or "P/S") ratio of 0.1x right now seems quite "middle-of-the-road" compared to the Electronic industry in Hong Kong, where the median P/S ratio is around 0.4x. Although, it's not wise to simply ignore the P/S without explanation as investors may be disregarding a distinct opportunity or a costly mistake.
Check out our latest analysis for Renco Holdings Group
How Renco Holdings Group Has Been Performing
For example, consider that Renco Holdings Group's financial performance has been poor lately as its revenue has been in decline. It might be that many expect the company to put the disappointing revenue performance behind them over the coming period, which has kept the P/S from falling. If you like the company, you'd at least be hoping this is the case so that you could potentially pick up some stock while it's not quite in favour.
Want the full picture on earnings, revenue and cash flow for the company? Then our free report on Renco Holdings Group will help you shine a light on its historical performance.Do Revenue Forecasts Match The P/S Ratio?
In order to justify its P/S ratio, Renco Holdings Group would need to produce growth that's similar to the industry.
In reviewing the last year of financials, we were disheartened to see the company's revenues fell to the tune of 29%. Even so, admirably revenue has lifted 195% in aggregate from three years ago, notwithstanding the last 12 months. Although it's been a bumpy ride, it's still fair to say the revenue growth recently has been more than adequate for the company.
This is in contrast to the rest of the industry, which is expected to grow by 13% over the next year, materially lower than the company's recent medium-term annualised growth rates.
In light of this, it's curious that Renco Holdings Group's P/S sits in line with the majority of other companies. It may be that most investors are not convinced the company can maintain its recent growth rates.
The Final Word
Renco Holdings Group's stock has a lot of momentum behind it lately, which has brought its P/S level with the rest of the industry. Generally, our preference is to limit the use of the price-to-sales ratio to establishing what the market thinks about the overall health of a company.
We've established that Renco Holdings Group currently trades on a lower than expected P/S since its recent three-year growth is higher than the wider industry forecast. There could be some unobserved threats to revenue preventing the P/S ratio from matching this positive performance. While recent revenue trends over the past medium-term suggest that the risk of a price decline is low, investors appear to see the likelihood of revenue fluctuations in the future.
And what about other risks? Every company has them, and we've spotted 3 warning signs for Renco Holdings Group you should know about.
Of course, profitable companies with a history of great earnings growth are generally safer bets. So you may wish to see this free collection of other companies that have reasonable P/E ratios and have grown earnings strongly.
New: AI Stock Screener & Alerts
Our new AI Stock Screener scans the market every day to uncover opportunities.
• Dividend Powerhouses (3%+ Yield)
• Undervalued Small Caps with Insider Buying
• High growth Tech and AI Companies
Or build your own from over 50 metrics.
Have feedback on this article? Concerned about the content? Get in touch with us directly. Alternatively, email editorial-team (at) simplywallst.com.
This article by Simply Wall St is general in nature. We provide commentary based on historical data and analyst forecasts only using an unbiased methodology and our articles are not intended to be financial advice. It does not constitute a recommendation to buy or sell any stock, and does not take account of your objectives, or your financial situation. We aim to bring you long-term focused analysis driven by fundamental data. Note that our analysis may not factor in the latest price-sensitive company announcements or qualitative material. Simply Wall St has no position in any stocks mentioned.
About SEHK:2323
Renco Holdings Group
An investment holding company, manufactures and sells printed circuit boards.
Good value slight.
Market Insights

Advertisement
Community Narratives
MicroVision will explode future revenue by 380.37% with a vision towards success
Fair Value US$60|98.4% undervalued
TH
Community Contributor
The Indispensable Artery for a New North American Economy
Fair Value CA$132.87|3.6% undervalued
TI
Community Contributor
Recently Updated Narratives
BE


Bejgal on MINISO Group Holding ·
MINISO's fair value is projected at 26.69 with an anticipated PE ratio shift of 20x
Fair Value:US$26.6927.9% undervalued
45 followersusers have followed this narrative
3 commentsusers have commented on this narrative
0 likesusers have liked this narrative
TI


TickerTickle on Oracle ·
The Quiet Giant That Became AI’s Power Grid
Fair Value:US$389.8148.6% undervalued
6 followersusers have followed this narrative
0 commentsusers have commented on this narrative
0 likesusers have liked this narrative
AU

AuCA on Nova Ljubljanska Banka d.d ·
Nova Ljubljanska Banka d.d will expect a 11.2% revenue boost driving future growth
Fair Value:€20916.3% undervalued
23 followersusers have followed this narrative
3 commentsusers have commented on this narrative
0 likesusers have liked this narrative
Popular Narratives
OS


oscargarcia on Alphabet ·
The company that turned a verb into a global necessity and basically runs the modern internet, digital ads, smartphones, maps, and AI.
Fair Value:US$3406.3% undervalued
130 followersusers have followed this narrative
6 commentsusers have commented on this narrative
17 likesusers have liked this narrative
TH

TheWallstreetKing on MicroVision ·
MicroVision will explode future revenue by 380.37% with a vision towards success
Fair Value:US$6098.4% undervalued
81 followersusers have followed this narrative
10 commentsusers have commented on this narrative
18 likesusers have liked this narrative
AN


AnalystConsensusTarget on NVIDIA ·
NVDA: Expanding AI Demand Will Drive Major Data Center Investments Through 2026
Fair Value:US$232.7921.6% undervalued
919 followersusers have followed this narrative
5 commentsusers have commented on this narrative
21 likesusers have liked this narrative