
Advertisement
- Hong Kong
- /
- Electronic Equipment and Components
- /
- SEHK:2323
Market Might Still Lack Some Conviction On Renco Holdings Group Limited (HKG:2323) Even After 31% Share Price Boost
Renco Holdings Group Limited (HKG:2323) shares have had a really impressive month, gaining 31% after a shaky period beforehand. But the last month did very little to improve the 54% share price decline over the last year.
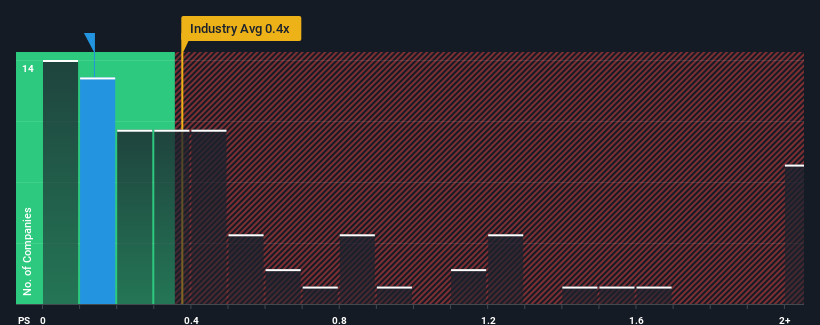
Even after such a large jump in price, there still wouldn't be many who think Renco Holdings Group's price-to-sales (or "P/S") ratio of 0.1x is worth a mention when the median P/S in Hong Kong's Electronic industry is similar at about 0.4x. Although, it's not wise to simply ignore the P/S without explanation as investors may be disregarding a distinct opportunity or a costly mistake.
Check out our latest analysis for Renco Holdings Group
How Has Renco Holdings Group Performed Recently?
For instance, Renco Holdings Group's receding revenue in recent times would have to be some food for thought. It might be that many expect the company to put the disappointing revenue performance behind them over the coming period, which has kept the P/S from falling. If you like the company, you'd at least be hoping this is the case so that you could potentially pick up some stock while it's not quite in favour.
Want the full picture on earnings, revenue and cash flow for the company? Then our free report on Renco Holdings Group will help you shine a light on its historical performance.What Are Revenue Growth Metrics Telling Us About The P/S?
The only time you'd be comfortable seeing a P/S like Renco Holdings Group's is when the company's growth is tracking the industry closely.
Retrospectively, the last year delivered a frustrating 29% decrease to the company's top line. However, a few very strong years before that means that it was still able to grow revenue by an impressive 195% in total over the last three years. So we can start by confirming that the company has generally done a very good job of growing revenue over that time, even though it had some hiccups along the way.
This is in contrast to the rest of the industry, which is expected to grow by 13% over the next year, materially lower than the company's recent medium-term annualised growth rates.
With this information, we find it interesting that Renco Holdings Group is trading at a fairly similar P/S compared to the industry. Apparently some shareholders believe the recent performance is at its limits and have been accepting lower selling prices.
What Does Renco Holdings Group's P/S Mean For Investors?
Renco Holdings Group's stock has a lot of momentum behind it lately, which has brought its P/S level with the rest of the industry. While the price-to-sales ratio shouldn't be the defining factor in whether you buy a stock or not, it's quite a capable barometer of revenue expectations.
We didn't quite envision Renco Holdings Group's P/S sitting in line with the wider industry, considering the revenue growth over the last three-year is higher than the current industry outlook. When we see strong revenue with faster-than-industry growth, we can only assume potential risks are what might be placing pressure on the P/S ratio. At least the risk of a price drop looks to be subdued if recent medium-term revenue trends continue, but investors seem to think future revenue could see some volatility.
Before you settle on your opinion, we've discovered 3 warning signs for Renco Holdings Group that you should be aware of.
If companies with solid past earnings growth is up your alley, you may wish to see this free collection of other companies with strong earnings growth and low P/E ratios.
New: AI Stock Screener & Alerts
Our new AI Stock Screener scans the market every day to uncover opportunities.
• Dividend Powerhouses (3%+ Yield)
• Undervalued Small Caps with Insider Buying
• High growth Tech and AI Companies
Or build your own from over 50 metrics.
Have feedback on this article? Concerned about the content? Get in touch with us directly. Alternatively, email editorial-team (at) simplywallst.com.
This article by Simply Wall St is general in nature. We provide commentary based on historical data and analyst forecasts only using an unbiased methodology and our articles are not intended to be financial advice. It does not constitute a recommendation to buy or sell any stock, and does not take account of your objectives, or your financial situation. We aim to bring you long-term focused analysis driven by fundamental data. Note that our analysis may not factor in the latest price-sensitive company announcements or qualitative material. Simply Wall St has no position in any stocks mentioned.
About SEHK:2323
Renco Holdings Group
An investment holding company, manufactures and sells printed circuit boards.
Good value slight.
Market Insights

Advertisement
Community Narratives
MicroVision will explode future revenue by 380.37% with a vision towards success
Fair Value US$60.00|98.4% undervalued
TH
Community Contributor
The Indispensable Artery for a New North American Economy
Fair Value CA$132.87|1.3% undervalued
TI
Community Contributor