
Advertisement
- Hong Kong
- /
- Electronic Equipment and Components
- /
- SEHK:2323
Does Renco Holdings Group (HKG:2323) Have A Healthy Balance Sheet?
Howard Marks put it nicely when he said that, rather than worrying about share price volatility, 'The possibility of permanent loss is the risk I worry about... and every practical investor I know worries about.' When we think about how risky a company is, we always like to look at its use of debt, since debt overload can lead to ruin. We note that Renco Holdings Group Limited (HKG:2323) does have debt on its balance sheet. But the real question is whether this debt is making the company risky.
Why Does Debt Bring Risk?
Generally speaking, debt only becomes a real problem when a company can't easily pay it off, either by raising capital or with its own cash flow. Ultimately, if the company can't fulfill its legal obligations to repay debt, shareholders could walk away with nothing. However, a more frequent (but still costly) occurrence is where a company must issue shares at bargain-basement prices, permanently diluting shareholders, just to shore up its balance sheet. Of course, debt can be an important tool in businesses, particularly capital heavy businesses. When we think about a company's use of debt, we first look at cash and debt together.
View our latest analysis for Renco Holdings Group
What Is Renco Holdings Group's Debt?
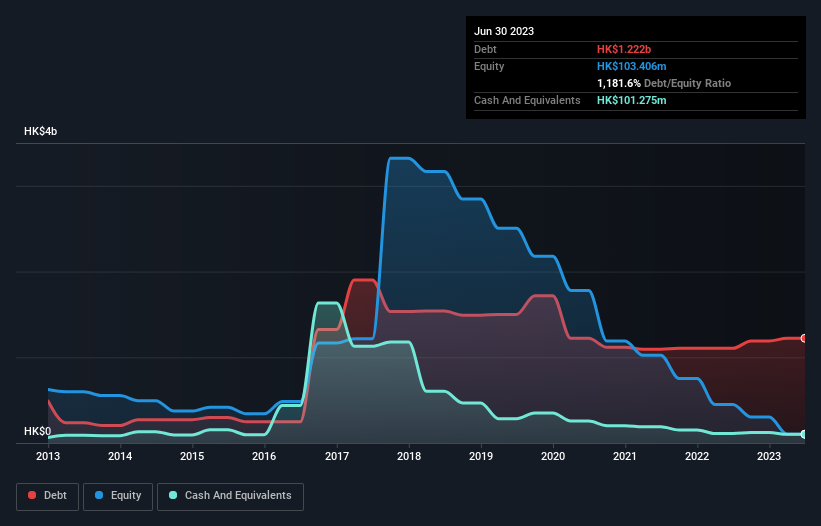
You can click the graphic below for the historical numbers, but it shows that as of June 2023 Renco Holdings Group had HK$1.22b of debt, an increase on HK$1.10b, over one year. However, because it has a cash reserve of HK$101.3m, its net debt is less, at about HK$1.12b.
How Strong Is Renco Holdings Group's Balance Sheet?
We can see from the most recent balance sheet that Renco Holdings Group had liabilities of HK$1.55b falling due within a year, and liabilities of HK$193.5m due beyond that. On the other hand, it had cash of HK$101.3m and HK$826.2m worth of receivables due within a year. So its liabilities outweigh the sum of its cash and (near-term) receivables by HK$815.0m.
The deficiency here weighs heavily on the HK$53.0m company itself, as if a child were struggling under the weight of an enormous back-pack full of books, his sports gear, and a trumpet. So we definitely think shareholders need to watch this one closely. After all, Renco Holdings Group would likely require a major re-capitalisation if it had to pay its creditors today. When analysing debt levels, the balance sheet is the obvious place to start. But you can't view debt in total isolation; since Renco Holdings Group will need earnings to service that debt. So if you're keen to discover more about its earnings, it might be worth checking out this graph of its long term earnings trend.
Over 12 months, Renco Holdings Group made a loss at the EBIT level, and saw its revenue drop to HK$328m, which is a fall of 29%. That makes us nervous, to say the least.
Caveat Emptor
Not only did Renco Holdings Group's revenue slip over the last twelve months, but it also produced negative earnings before interest and tax (EBIT). Its EBIT loss was a whopping HK$214m. Reflecting on this and the significant total liabilities, it's hard to know what to say about the stock because of our intense dis-affinity for it. Like every long-shot we're sure it has a glossy presentation outlining its blue-sky potential. But the fact is that it incinerated HK$2.6m of cash in the last twelve months, and has precious few liquid assets in comparison to its liabilities. So we consider this a high risk stock, and we're worried its share price could sink faster than than a dingy with a great white shark attacking it. The balance sheet is clearly the area to focus on when you are analysing debt. But ultimately, every company can contain risks that exist outside of the balance sheet. For instance, we've identified 3 warning signs for Renco Holdings Group that you should be aware of.
If you're interested in investing in businesses that can grow profits without the burden of debt, then check out this free list of growing businesses that have net cash on the balance sheet.
New: AI Stock Screener & Alerts
Our new AI Stock Screener scans the market every day to uncover opportunities.
• Dividend Powerhouses (3%+ Yield)
• Undervalued Small Caps with Insider Buying
• High growth Tech and AI Companies
Or build your own from over 50 metrics.
Have feedback on this article? Concerned about the content? Get in touch with us directly. Alternatively, email editorial-team (at) simplywallst.com.
This article by Simply Wall St is general in nature. We provide commentary based on historical data and analyst forecasts only using an unbiased methodology and our articles are not intended to be financial advice. It does not constitute a recommendation to buy or sell any stock, and does not take account of your objectives, or your financial situation. We aim to bring you long-term focused analysis driven by fundamental data. Note that our analysis may not factor in the latest price-sensitive company announcements or qualitative material. Simply Wall St has no position in any stocks mentioned.
About SEHK:2323
Renco Holdings Group
An investment holding company, manufactures and sells printed circuit boards.
Good value slight.
Market Insights

Advertisement
Community Narratives
MicroVision will explode future revenue by 380.37% with a vision towards success
Fair Value US$60.00|98.4% undervalued
TH
Community Contributor
The Indispensable Artery for a New North American Economy
Fair Value CA$132.87|1.3% undervalued
TI
Community Contributor