- Hong Kong
- /
- Electronic Equipment and Components
- /
- SEHK:1708
Does Nanjing Sample Technology (HKG:1708) Have A Healthy Balance Sheet?

Howard Marks put it nicely when he said that, rather than worrying about share price volatility, 'The possibility of permanent loss is the risk I worry about... and every practical investor I know worries about.' When we think about how risky a company is, we always like to look at its use of debt, since debt overload can lead to ruin. As with many other companies Nanjing Sample Technology Company Limited (HKG:1708) makes use of debt. But is this debt a concern to shareholders?
When Is Debt A Problem?
Debt assists a business until the business has trouble paying it off, either with new capital or with free cash flow. Ultimately, if the company can't fulfill its legal obligations to repay debt, shareholders could walk away with nothing. While that is not too common, we often do see indebted companies permanently diluting shareholders because lenders force them to raise capital at a distressed price. Of course, the upside of debt is that it often represents cheap capital, especially when it replaces dilution in a company with the ability to reinvest at high rates of return. When we examine debt levels, we first consider both cash and debt levels, together.
View our latest analysis for Nanjing Sample Technology
How Much Debt Does Nanjing Sample Technology Carry?
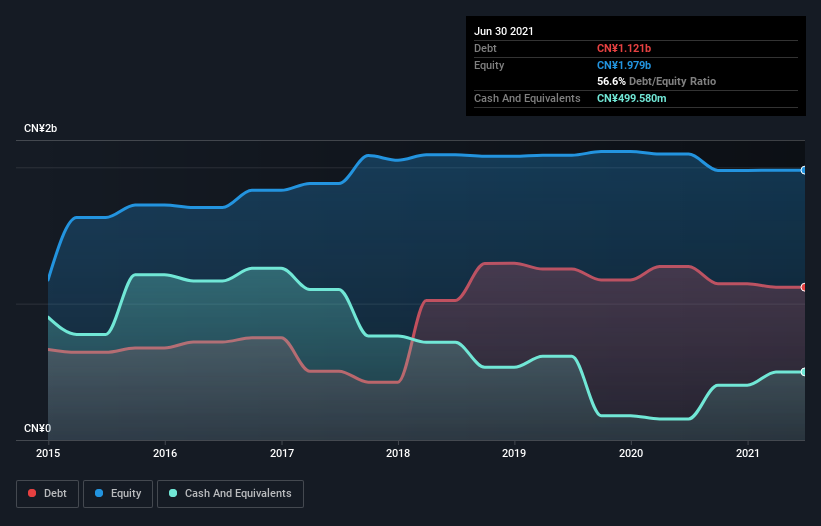
You can click the graphic below for the historical numbers, but it shows that Nanjing Sample Technology had CN¥1.12b of debt in June 2021, down from CN¥1.27b, one year before. On the flip side, it has CN¥499.6m in cash leading to net debt of about CN¥620.9m.
How Strong Is Nanjing Sample Technology's Balance Sheet?
The latest balance sheet data shows that Nanjing Sample Technology had liabilities of CN¥2.01b due within a year, and liabilities of CN¥424.8m falling due after that. Offsetting these obligations, it had cash of CN¥499.6m as well as receivables valued at CN¥1.62b due within 12 months. So its liabilities outweigh the sum of its cash and (near-term) receivables by CN¥314.0m.
Since publicly traded Nanjing Sample Technology shares are worth a total of CN¥3.38b, it seems unlikely that this level of liabilities would be a major threat. Having said that, it's clear that we should continue to monitor its balance sheet, lest it change for the worse. The balance sheet is clearly the area to focus on when you are analysing debt. But you can't view debt in total isolation; since Nanjing Sample Technology will need earnings to service that debt. So when considering debt, it's definitely worth looking at the earnings trend. Click here for an interactive snapshot.
In the last year Nanjing Sample Technology wasn't profitable at an EBIT level, but managed to grow its revenue by 26%, to CN¥1.2b. Shareholders probably have their fingers crossed that it can grow its way to profits.
Caveat Emptor
Despite the top line growth, Nanjing Sample Technology still had an earnings before interest and tax (EBIT) loss over the last year. To be specific the EBIT loss came in at CN¥116m. Considering that alongside the liabilities mentioned above does not give us much confidence that company should be using so much debt. So we think its balance sheet is a little strained, though not beyond repair. For example, we would not want to see a repeat of last year's loss of CN¥147m. So we do think this stock is quite risky. There's no doubt that we learn most about debt from the balance sheet. But ultimately, every company can contain risks that exist outside of the balance sheet. Case in point: We've spotted 3 warning signs for Nanjing Sample Technology you should be aware of, and 2 of them make us uncomfortable.
If, after all that, you're more interested in a fast growing company with a rock-solid balance sheet, then check out our list of net cash growth stocks without delay.
The New Payments ETF Is Live on NASDAQ:
Money is moving to real-time rails, and a newly listed ETF now gives investors direct exposure. Fast settlement. Institutional custody. Simple access.
Explore how this launch could reshape portfolios
Sponsored ContentValuation is complex, but we're here to simplify it.
Discover if Nanjing Sample Technology might be undervalued or overvalued with our detailed analysis, featuring fair value estimates, potential risks, dividends, insider trades, and its financial condition.
Access Free AnalysisThis article by Simply Wall St is general in nature. We provide commentary based on historical data and analyst forecasts only using an unbiased methodology and our articles are not intended to be financial advice. It does not constitute a recommendation to buy or sell any stock, and does not take account of your objectives, or your financial situation. We aim to bring you long-term focused analysis driven by fundamental data. Note that our analysis may not factor in the latest price-sensitive company announcements or qualitative material. Simply Wall St has no position in any stocks mentioned.
Have feedback on this article? Concerned about the content? Get in touch with us directly. Alternatively, email editorial-team (at) simplywallst.com.
About SEHK:1708
Nanjing Sample Technology
Provides visual identification and radio frequency identification (RFID) solutions to intelligent transportation, customs logistics, and other application areas in the People’s Republic of China.
Adequate balance sheet and slightly overvalued.
Similar Companies
Market Insights

Weekly Picks

Early mover in a fast growing industry. Likely to experience share price volatility as they scale


A case for CA$31.80 (undiluted), aka 8,616% upside from CA$0.37 (an 86 bagger!).


Moderation and Stabilisation: HOLD: Fair Price based on a 4-year Cycle is $12.08
Recently Updated Narratives

Automotive Electronics Manufacturer Consistent and Stable

Airbnb Stock: Platform Growth in a World of Saturation and Scrutiny

Adobe Stock: AI-Fueled ARR Growth Pushes Guidance Higher, But Cost Pressures Loom
Popular Narratives


Crazy Undervalued 42 Baggers Silver Play (Active & Running Mine)


NVDA: Expanding AI Demand Will Drive Major Data Center Investments Through 2026

The AI Infrastructure Giant Grows Into Its Valuation
Trending Discussion


