
Advertisement
Tianli Holdings Group Limited (HKG:117) Shares May Have Slumped 29% But Getting In Cheap Is Still Unlikely
The Tianli Holdings Group Limited (HKG:117) share price has softened a substantial 29% over the previous 30 days, handing back much of the gains the stock has made lately. Instead of being rewarded, shareholders who have already held through the last twelve months are now sitting on a 43% share price drop.
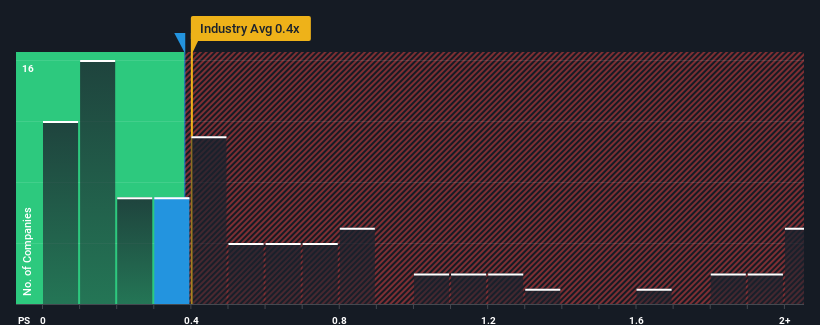
Although its price has dipped substantially, it's still not a stretch to say that Tianli Holdings Group's price-to-sales (or "P/S") ratio of 0.4x right now seems quite "middle-of-the-road" compared to the Electronic industry in Hong Kong, seeing as it matches the P/S ratio of the wider industry. However, investors might be overlooking a clear opportunity or potential setback if there is no rational basis for the P/S.
Check out our latest analysis for Tianli Holdings Group
How Tianli Holdings Group Has Been Performing
Tianli Holdings Group certainly has been doing a great job lately as it's been growing its revenue at a really rapid pace. It might be that many expect the strong revenue performance to wane, which has kept the share price, and thus the P/S ratio, from rising. If that doesn't eventuate, then existing shareholders have reason to be feeling optimistic about the future direction of the share price.
We don't have analyst forecasts, but you can see how recent trends are setting up the company for the future by checking out our free report on Tianli Holdings Group's earnings, revenue and cash flow.How Is Tianli Holdings Group's Revenue Growth Trending?
The only time you'd be comfortable seeing a P/S like Tianli Holdings Group's is when the company's growth is tracking the industry closely.
Taking a look back first, we see that the company grew revenue by an impressive 35% last year. As a result, it also grew revenue by 11% in total over the last three years. Therefore, it's fair to say the revenue growth recently has been respectable for the company.
This is in contrast to the rest of the industry, which is expected to grow by 17% over the next year, materially higher than the company's recent medium-term annualised growth rates.
In light of this, it's curious that Tianli Holdings Group's P/S sits in line with the majority of other companies. It seems most investors are ignoring the fairly limited recent growth rates and are willing to pay up for exposure to the stock. They may be setting themselves up for future disappointment if the P/S falls to levels more in line with recent growth rates.
What Does Tianli Holdings Group's P/S Mean For Investors?
With its share price dropping off a cliff, the P/S for Tianli Holdings Group looks to be in line with the rest of the Electronic industry. Using the price-to-sales ratio alone to determine if you should sell your stock isn't sensible, however it can be a practical guide to the company's future prospects.
Our examination of Tianli Holdings Group revealed its poor three-year revenue trends aren't resulting in a lower P/S as per our expectations, given they look worse than current industry outlook. Right now we are uncomfortable with the P/S as this revenue performance isn't likely to support a more positive sentiment for long. Unless there is a significant improvement in the company's medium-term performance, it will be difficult to prevent the P/S ratio from declining to a more reasonable level.
We don't want to rain on the parade too much, but we did also find 3 warning signs for Tianli Holdings Group (2 shouldn't be ignored!) that you need to be mindful of.
If these risks are making you reconsider your opinion on Tianli Holdings Group, explore our interactive list of high quality stocks to get an idea of what else is out there.
Valuation is complex, but we're here to simplify it.
Discover if Tianli Holdings Group might be undervalued or overvalued with our detailed analysis, featuring fair value estimates, potential risks, dividends, insider trades, and its financial condition.
Access Free AnalysisHave feedback on this article? Concerned about the content? Get in touch with us directly. Alternatively, email editorial-team (at) simplywallst.com.
This article by Simply Wall St is general in nature. We provide commentary based on historical data and analyst forecasts only using an unbiased methodology and our articles are not intended to be financial advice. It does not constitute a recommendation to buy or sell any stock, and does not take account of your objectives, or your financial situation. We aim to bring you long-term focused analysis driven by fundamental data. Note that our analysis may not factor in the latest price-sensitive company announcements or qualitative material. Simply Wall St has no position in any stocks mentioned.
About SEHK:117
Tianli Holdings Group
An investment holding company, manufactures and sells multi-layer ceramic capacitors (MLCC) in Mainland China, Hong Kong, and internationally.
Slight risk and overvalued.
Market Insights

Advertisement
Community Narratives
MINISO's fair value is projected at 26.69 with an anticipated PE ratio shift of 20x
Fair Value US$24.03|11.0% undervalued
BE
Community Contributor
Procter & Gamble: A Dividend Giant Facing Slowing Growth
Fair Value US$119.81|23.3% overvalued
AN
Community Contributor
Eli Lilly's Future Growth Driven by Tirzepatide and Favorable Market Conditions
Fair Value US$1.19k|13.8% undervalued
EA
Community Contributor