
Advertisement
- Hong Kong
- /
- Electronic Equipment and Components
- /
- SEHK:1050
Why We Like The Returns At Karrie International Holdings (HKG:1050)
If you're not sure where to start when looking for the next multi-bagger, there are a few key trends you should keep an eye out for. Firstly, we'll want to see a proven return on capital employed (ROCE) that is increasing, and secondly, an expanding base of capital employed. If you see this, it typically means it's a company with a great business model and plenty of profitable reinvestment opportunities. And in light of that, the trends we're seeing at Karrie International Holdings' (HKG:1050) look very promising so lets take a look.
Return On Capital Employed (ROCE): What Is It?
For those who don't know, ROCE is a measure of a company's yearly pre-tax profit (its return), relative to the capital employed in the business. The formula for this calculation on Karrie International Holdings is:
Return on Capital Employed = Earnings Before Interest and Tax (EBIT) ÷ (Total Assets - Current Liabilities)
0.21 = HK$249m ÷ (HK$2.6b - HK$1.4b) (Based on the trailing twelve months to March 2023).
Thus, Karrie International Holdings has an ROCE of 21%. In absolute terms that's a great return and it's even better than the Electronic industry average of 8.3%.
View our latest analysis for Karrie International Holdings
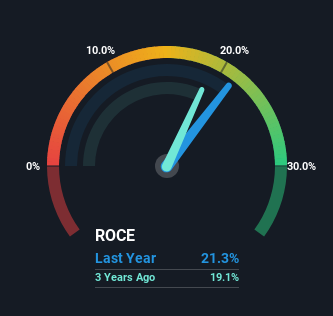
Historical performance is a great place to start when researching a stock so above you can see the gauge for Karrie International Holdings' ROCE against it's prior returns. If you'd like to look at how Karrie International Holdings has performed in the past in other metrics, you can view this free graph of past earnings, revenue and cash flow.
How Are Returns Trending?
We're pretty happy with how the ROCE has been trending at Karrie International Holdings. The data shows that returns on capital have increased by 39% over the trailing five years. The company is now earning HK$0.2 per dollar of capital employed. In regards to capital employed, Karrie International Holdings appears to been achieving more with less, since the business is using 31% less capital to run its operation. If this trend continues, the business might be getting more efficient but it's shrinking in terms of total assets.
On a side note, we noticed that the improvement in ROCE appears to be partly fueled by an increase in current liabilities. Essentially the business now has suppliers or short-term creditors funding about 54% of its operations, which isn't ideal. Given it's pretty high ratio, we'd remind investors that having current liabilities at those levels can bring about some risks in certain businesses.
In Conclusion...
In a nutshell, we're pleased to see that Karrie International Holdings has been able to generate higher returns from less capital. Since the stock has only returned 28% to shareholders over the last five years, the promising fundamentals may not be recognized yet by investors. So exploring more about this stock could uncover a good opportunity, if the valuation and other metrics stack up.
If you'd like to know about the risks facing Karrie International Holdings, we've discovered 3 warning signs that you should be aware of.
High returns are a key ingredient to strong performance, so check out our free list ofstocks earning high returns on equity with solid balance sheets.
Valuation is complex, but we're here to simplify it.
Discover if Karrie International Holdings might be undervalued or overvalued with our detailed analysis, featuring fair value estimates, potential risks, dividends, insider trades, and its financial condition.
Access Free AnalysisHave feedback on this article? Concerned about the content? Get in touch with us directly. Alternatively, email editorial-team (at) simplywallst.com.
This article by Simply Wall St is general in nature. We provide commentary based on historical data and analyst forecasts only using an unbiased methodology and our articles are not intended to be financial advice. It does not constitute a recommendation to buy or sell any stock, and does not take account of your objectives, or your financial situation. We aim to bring you long-term focused analysis driven by fundamental data. Note that our analysis may not factor in the latest price-sensitive company announcements or qualitative material. Simply Wall St has no position in any stocks mentioned.
About SEHK:1050
Karrie International Holdings
An investment holding company, manufactures and sells metal, plastic, and electronic products in Hong Kong, Japan, Mainland China, Asia, North America, and Western Europe.
Excellent balance sheet with proven track record.
Market Insights

Advertisement
Community Narratives
The company that turned a verb into a global necessity and basically runs the modern internet, digital ads, smartphones, maps, and AI.
Fair Value US$300.00|8.5% undervalued
OS
Community Contributor
Flowers Foods Pays A Fair Price For Health
Fair Value US$16.12|24.6% undervalued
NV
Community Contributor
TMX Group will thrive with 33.3% profit margin and enduring market moat
Fair Value CA$49.90|0.1% undervalued
LI
Community Contributor