
Advertisement
China Youzan Limited (HKG:8083) May Have Run Too Fast Too Soon With Recent 25% Price Plummet
China Youzan Limited (HKG:8083) shareholders that were waiting for something to happen have been dealt a blow with a 25% share price drop in the last month. The recent drop completes a disastrous twelve months for shareholders, who are sitting on a 62% loss during that time.
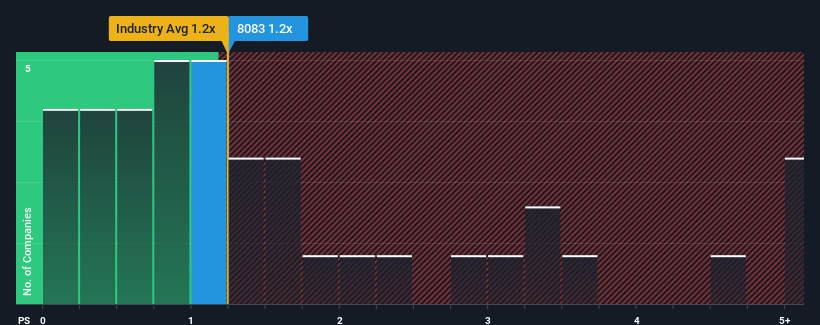
Even after such a large drop in price, there still wouldn't be many who think China Youzan's price-to-sales (or "P/S") ratio of 1.2x is worth a mention when it essentially matches the median P/S in Hong Kong's Software industry. Although, it's not wise to simply ignore the P/S without explanation as investors may be disregarding a distinct opportunity or a costly mistake.
Check out our latest analysis for China Youzan
What Does China Youzan's P/S Mean For Shareholders?
China Youzan could be doing better as its revenue has been going backwards lately while most other companies have been seeing positive revenue growth. Perhaps the market is expecting its poor revenue performance to improve, keeping the P/S from dropping. You'd really hope so, otherwise you're paying a relatively elevated price for a company with this sort of growth profile.
Want the full picture on analyst estimates for the company? Then our free report on China Youzan will help you uncover what's on the horizon.Do Revenue Forecasts Match The P/S Ratio?
There's an inherent assumption that a company should be matching the industry for P/S ratios like China Youzan's to be considered reasonable.
Taking a look back first, the company's revenue growth last year wasn't something to get excited about as it posted a disappointing decline of 3.2%. As a result, revenue from three years ago have also fallen 20% overall. Accordingly, shareholders would have felt downbeat about the medium-term rates of revenue growth.
Turning to the outlook, the next three years should generate growth of 5.3% per year as estimated by the two analysts watching the company. Meanwhile, the rest of the industry is forecast to expand by 21% per annum, which is noticeably more attractive.
With this information, we find it interesting that China Youzan is trading at a fairly similar P/S compared to the industry. Apparently many investors in the company are less bearish than analysts indicate and aren't willing to let go of their stock right now. Maintaining these prices will be difficult to achieve as this level of revenue growth is likely to weigh down the shares eventually.
The Final Word
Following China Youzan's share price tumble, its P/S is just clinging on to the industry median P/S. Typically, we'd caution against reading too much into price-to-sales ratios when settling on investment decisions, though it can reveal plenty about what other market participants think about the company.
Our look at the analysts forecasts of China Youzan's revenue prospects has shown that its inferior revenue outlook isn't negatively impacting its P/S as much as we would have predicted. When we see companies with a relatively weaker revenue outlook compared to the industry, we suspect the share price is at risk of declining, sending the moderate P/S lower. This places shareholders' investments at risk and potential investors in danger of paying an unnecessary premium.
Having said that, be aware China Youzan is showing 2 warning signs in our investment analysis, and 1 of those is a bit concerning.
If companies with solid past earnings growth is up your alley, you may wish to see this free collection of other companies with strong earnings growth and low P/E ratios.
New: Manage All Your Stock Portfolios in One Place
We've created the ultimate portfolio companion for stock investors, and it's free.
• Connect an unlimited number of Portfolios and see your total in one currency
• Be alerted to new Warning Signs or Risks via email or mobile
• Track the Fair Value of your stocks
Have feedback on this article? Concerned about the content? Get in touch with us directly. Alternatively, email editorial-team (at) simplywallst.com.
This article by Simply Wall St is general in nature. We provide commentary based on historical data and analyst forecasts only using an unbiased methodology and our articles are not intended to be financial advice. It does not constitute a recommendation to buy or sell any stock, and does not take account of your objectives, or your financial situation. We aim to bring you long-term focused analysis driven by fundamental data. Note that our analysis may not factor in the latest price-sensitive company announcements or qualitative material. Simply Wall St has no position in any stocks mentioned.
Have feedback on this article? Concerned about the content? Get in touch with us directly. Alternatively, email editorial-team@simplywallst.com
About SEHK:8083
Youzan Technology
An investment holding company, provides online and offline e-commerce solutions in the People’s Republic of China, Japan, and Canada.
Excellent balance sheet with reasonable growth potential.
Similar Companies
Market Insights

Advertisement
Community Narratives
MicroVision will explode future revenue by 380.37% with a vision towards success
Fair Value US$60.00|98.5% undervalued
TH
Community Contributor
The Indispensable Artery for a New North American Economy
Fair Value CA$132.87|2.3% undervalued
TI
Community Contributor