Weimob Inc.'s (HKG:2013) 33% Dip Still Leaving Some Shareholders Feeling Restless Over Its P/SRatio

The Weimob Inc. (HKG:2013) share price has fared very poorly over the last month, falling by a substantial 33%. To make matters worse, the recent drop has wiped out a year's worth of gains with the share price now back where it started a year ago.
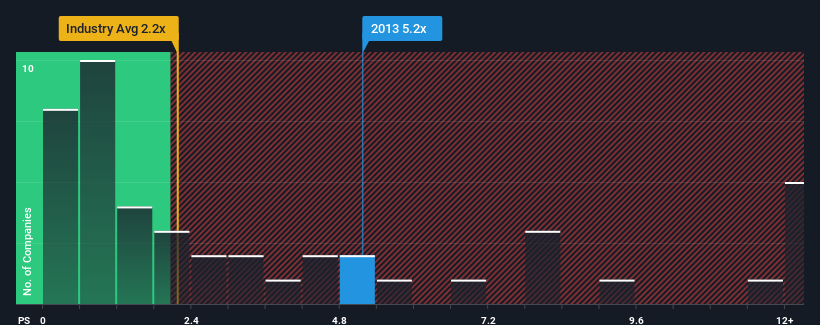
Even after such a large drop in price, you could still be forgiven for thinking Weimob is a stock to steer clear of with a price-to-sales ratios (or "P/S") of 5.2x, considering almost half the companies in Hong Kong's Software industry have P/S ratios below 2.2x. Although, it's not wise to just take the P/S at face value as there may be an explanation why it's so lofty.
View our latest analysis for Weimob
What Does Weimob's Recent Performance Look Like?
Weimob could be doing better as its revenue has been going backwards lately while most other companies have been seeing positive revenue growth. One possibility is that the P/S ratio is high because investors think this poor revenue performance will turn the corner. You'd really hope so, otherwise you're paying a pretty hefty price for no particular reason.
Want the full picture on analyst estimates for the company? Then our free report on Weimob will help you uncover what's on the horizon.Do Revenue Forecasts Match The High P/S Ratio?
There's an inherent assumption that a company should far outperform the industry for P/S ratios like Weimob's to be considered reasonable.
Taking a look back first, the company's revenue growth last year wasn't something to get excited about as it posted a disappointing decline of 40%. This means it has also seen a slide in revenue over the longer-term as revenue is down 32% in total over the last three years. So unfortunately, we have to acknowledge that the company has not done a great job of growing revenue over that time.
Shifting to the future, estimates from the nine analysts covering the company suggest revenue should grow by 17% per annum over the next three years. Meanwhile, the rest of the industry is forecast to expand by 37% each year, which is noticeably more attractive.
In light of this, it's alarming that Weimob's P/S sits above the majority of other companies. Apparently many investors in the company are way more bullish than analysts indicate and aren't willing to let go of their stock at any price. Only the boldest would assume these prices are sustainable as this level of revenue growth is likely to weigh heavily on the share price eventually.
What Does Weimob's P/S Mean For Investors?
A significant share price dive has done very little to deflate Weimob's very lofty P/S. Typically, we'd caution against reading too much into price-to-sales ratios when settling on investment decisions, though it can reveal plenty about what other market participants think about the company.
Despite analysts forecasting some poorer-than-industry revenue growth figures for Weimob, this doesn't appear to be impacting the P/S in the slightest. When we see a weak revenue outlook, we suspect the share price faces a much greater risk of declining, bringing back down the P/S figures. This places shareholders' investments at significant risk and potential investors in danger of paying an excessive premium.
We don't want to rain on the parade too much, but we did also find 3 warning signs for Weimob (1 is significant!) that you need to be mindful of.
If these risks are making you reconsider your opinion on Weimob, explore our interactive list of high quality stocks to get an idea of what else is out there.
Mobile Infrastructure for Defense and Disaster
The next wave in robotics isn't humanoid. Its fully autonomous towers delivering 5G, ISR, and radar in under 30 minutes, anywhere.
Get the investor briefing before the next round of contracts
Sponsored On Behalf of CiTechValuation is complex, but we're here to simplify it.
Discover if Weimob might be undervalued or overvalued with our detailed analysis, featuring fair value estimates, potential risks, dividends, insider trades, and its financial condition.
Access Free AnalysisHave feedback on this article? Concerned about the content? Get in touch with us directly. Alternatively, email editorial-team (at) simplywallst.com.
This article by Simply Wall St is general in nature. We provide commentary based on historical data and analyst forecasts only using an unbiased methodology and our articles are not intended to be financial advice. It does not constitute a recommendation to buy or sell any stock, and does not take account of your objectives, or your financial situation. We aim to bring you long-term focused analysis driven by fundamental data. Note that our analysis may not factor in the latest price-sensitive company announcements or qualitative material. Simply Wall St has no position in any stocks mentioned.
About SEHK:2013
Weimob
An investment holding company, provides digital commerce and media services in the People’s Republic of China.
Reasonable growth potential with adequate balance sheet.
Market Insights

Weekly Picks

Early mover in a fast growing industry. Likely to experience share price volatility as they scale


A case for CA$31.80 (undiluted), aka 8,616% upside from CA$0.37 (an 86 bagger!).


Moderation and Stabilisation: HOLD: Fair Price based on a 4-year Cycle is $12.08
Recently Updated Narratives


Title: Market Sentiment Is Dead Wrong — Here's Why PSEC Deserves a Second Look


An amazing opportunity to potentially get a 100 bagger

Amazon: Why the World’s Biggest Platform Still Runs on Invisible Economics
Popular Narratives


Crazy Undervalued 42 Baggers Silver Play (Active & Running Mine)


MicroVision will explode future revenue by 380.37% with a vision towards success


NVDA: Expanding AI Demand Will Drive Major Data Center Investments Through 2026
Trending Discussion
