
Advertisement
ICO Group Limited's (HKG:1460) Popularity With Investors Is Under Threat From Overpricing
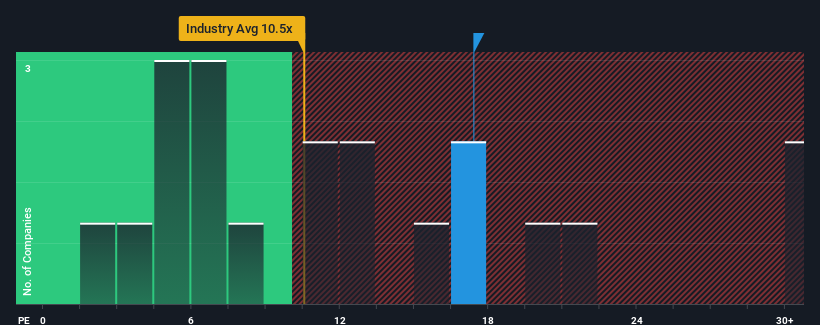
ICO Group Limited's (HKG:1460) price-to-earnings (or "P/E") ratio of 17.4x might make it look like a strong sell right now compared to the market in Hong Kong, where around half of the companies have P/E ratios below 8x and even P/E's below 4x are quite common. Although, it's not wise to just take the P/E at face value as there may be an explanation why it's so lofty.
For instance, ICO Group's receding earnings in recent times would have to be some food for thought. It might be that many expect the company to still outplay most other companies over the coming period, which has kept the P/E from collapsing. You'd really hope so, otherwise you're paying a pretty hefty price for no particular reason.
Check out our latest analysis for ICO Group
What Are Growth Metrics Telling Us About The High P/E?
ICO Group's P/E ratio would be typical for a company that's expected to deliver very strong growth, and importantly, perform much better than the market.
Retrospectively, the last year delivered a frustrating 9.2% decrease to the company's bottom line. As a result, earnings from three years ago have also fallen 89% overall. So unfortunately, we have to acknowledge that the company has not done a great job of growing earnings over that time.
In contrast to the company, the rest of the market is expected to grow by 22% over the next year, which really puts the company's recent medium-term earnings decline into perspective.
In light of this, it's alarming that ICO Group's P/E sits above the majority of other companies. Apparently many investors in the company are way more bullish than recent times would indicate and aren't willing to let go of their stock at any price. There's a very good chance existing shareholders are setting themselves up for future disappointment if the P/E falls to levels more in line with the recent negative growth rates.
What We Can Learn From ICO Group's P/E?
Generally, our preference is to limit the use of the price-to-earnings ratio to establishing what the market thinks about the overall health of a company.
We've established that ICO Group currently trades on a much higher than expected P/E since its recent earnings have been in decline over the medium-term. Right now we are increasingly uncomfortable with the high P/E as this earnings performance is highly unlikely to support such positive sentiment for long. Unless the recent medium-term conditions improve markedly, it's very challenging to accept these prices as being reasonable.
You should always think about risks. Case in point, we've spotted 5 warning signs for ICO Group you should be aware of, and 1 of them makes us a bit uncomfortable.
Of course, you might find a fantastic investment by looking at a few good candidates. So take a peek at this free list of companies with a strong growth track record, trading on a low P/E.
New: AI Stock Screener & Alerts
Our new AI Stock Screener scans the market every day to uncover opportunities.
• Dividend Powerhouses (3%+ Yield)
• Undervalued Small Caps with Insider Buying
• High growth Tech and AI Companies
Or build your own from over 50 metrics.
Have feedback on this article? Concerned about the content? Get in touch with us directly. Alternatively, email editorial-team (at) simplywallst.com.
This article by Simply Wall St is general in nature. We provide commentary based on historical data and analyst forecasts only using an unbiased methodology and our articles are not intended to be financial advice. It does not constitute a recommendation to buy or sell any stock, and does not take account of your objectives, or your financial situation. We aim to bring you long-term focused analysis driven by fundamental data. Note that our analysis may not factor in the latest price-sensitive company announcements or qualitative material. Simply Wall St has no position in any stocks mentioned.
About SEHK:1460
ICO Group
An investment holding company, provides IT application services to institutions and enterprises in Hong Kong and Malaysia.
Excellent balance sheet and good value.
Market Insights

Advertisement
Community Narratives
MicroVision will explode future revenue by 380.37% with a vision towards success
Fair Value US$60.00|98.4% undervalued
TH
Community Contributor
The Indispensable Artery for a New North American Economy
Fair Value CA$132.87|1.3% undervalued
TI
Community Contributor