
Advertisement
- Hong Kong
- /
- Semiconductors
- /
- SEHK:3800
What GCL Technology Holdings Limited's (HKG:3800) 39% Share Price Gain Is Not Telling You
GCL Technology Holdings Limited (HKG:3800) shareholders have had their patience rewarded with a 39% share price jump in the last month. Unfortunately, the gains of the last month did little to right the losses of the last year with the stock still down 19% over that time.
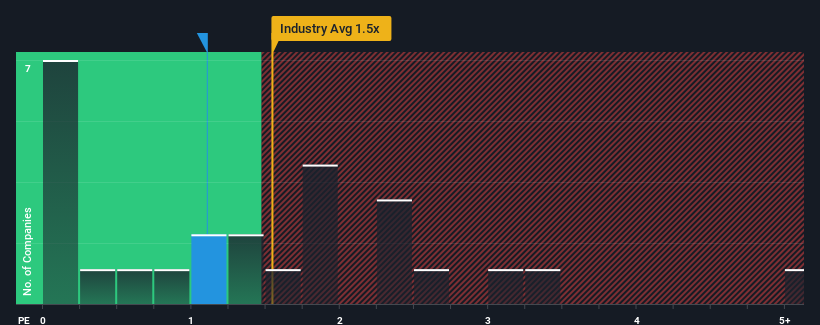
Even after such a large jump in price, it's still not a stretch to say that GCL Technology Holdings' price-to-sales (or "P/S") ratio of 1.1x right now seems quite "middle-of-the-road" compared to the Semiconductor industry in Hong Kong, where the median P/S ratio is around 1.5x. However, investors might be overlooking a clear opportunity or potential setback if there is no rational basis for the P/S.
Check out our latest analysis for GCL Technology Holdings
How Has GCL Technology Holdings Performed Recently?
GCL Technology Holdings could be doing better as its revenue has been going backwards lately while most other companies have been seeing positive revenue growth. It might be that many expect the dour revenue performance to strengthen positively, which has kept the P/S from falling. You'd really hope so, otherwise you're paying a relatively elevated price for a company with this sort of growth profile.
Want the full picture on analyst estimates for the company? Then our free report on GCL Technology Holdings will help you uncover what's on the horizon.Do Revenue Forecasts Match The P/S Ratio?
The only time you'd be comfortable seeing a P/S like GCL Technology Holdings' is when the company's growth is tracking the industry closely.
Taking a look back first, the company's revenue growth last year wasn't something to get excited about as it posted a disappointing decline of 6.2%. Even so, admirably revenue has lifted 130% in aggregate from three years ago, notwithstanding the last 12 months. Accordingly, while they would have preferred to keep the run going, shareholders would definitely welcome the medium-term rates of revenue growth.
Turning to the outlook, the next three years should generate growth of 5.8% each year as estimated by the analysts watching the company. That's shaping up to be materially lower than the 15% each year growth forecast for the broader industry.
In light of this, it's curious that GCL Technology Holdings' P/S sits in line with the majority of other companies. Apparently many investors in the company are less bearish than analysts indicate and aren't willing to let go of their stock right now. These shareholders may be setting themselves up for future disappointment if the P/S falls to levels more in line with the growth outlook.
What We Can Learn From GCL Technology Holdings' P/S?
Its shares have lifted substantially and now GCL Technology Holdings' P/S is back within range of the industry median. Using the price-to-sales ratio alone to determine if you should sell your stock isn't sensible, however it can be a practical guide to the company's future prospects.
Given that GCL Technology Holdings' revenue growth projections are relatively subdued in comparison to the wider industry, it comes as a surprise to see it trading at its current P/S ratio. At present, we aren't confident in the P/S as the predicted future revenues aren't likely to support a more positive sentiment for long. Circumstances like this present a risk to current and prospective investors who may see share prices fall if the low revenue growth impacts the sentiment.
Plus, you should also learn about these 2 warning signs we've spotted with GCL Technology Holdings (including 1 which is potentially serious).
If these risks are making you reconsider your opinion on GCL Technology Holdings, explore our interactive list of high quality stocks to get an idea of what else is out there.
New: Manage All Your Stock Portfolios in One Place
We've created the ultimate portfolio companion for stock investors, and it's free.
• Connect an unlimited number of Portfolios and see your total in one currency
• Be alerted to new Warning Signs or Risks via email or mobile
• Track the Fair Value of your stocks
Have feedback on this article? Concerned about the content? Get in touch with us directly. Alternatively, email editorial-team (at) simplywallst.com.
This article by Simply Wall St is general in nature. We provide commentary based on historical data and analyst forecasts only using an unbiased methodology and our articles are not intended to be financial advice. It does not constitute a recommendation to buy or sell any stock, and does not take account of your objectives, or your financial situation. We aim to bring you long-term focused analysis driven by fundamental data. Note that our analysis may not factor in the latest price-sensitive company announcements or qualitative material. Simply Wall St has no position in any stocks mentioned.
About SEHK:3800
GCL Technology Holdings
Manufactures and sells polysilicon and wafers products in the People’s Republic of China and internationally.
High growth potential and good value.
Similar Companies
Market Insights

Advertisement
Community Narratives
MicroVision will explode future revenue by 380.37% with a vision towards success
Fair Value US$60|98.4% undervalued
TH
Community Contributor
The Indispensable Artery for a New North American Economy
Fair Value CA$132.87|0.6% undervalued
TI
Community Contributor
Recently Updated Narratives
BL


BlackGoat on Alphabet ·
Alphabet: The Under-appreciated Compounder Hiding in Plain Sight
Fair Value:US$324.481.3% undervalued
74 followersusers have followed this narrative
3 commentsusers have commented on this narrative
1 likeusers have liked this narrative
BE


Bejgal on MINISO Group Holding ·
MINISO's fair value is projected at 26.69 with an anticipated PE ratio shift of 20x
Fair Value:US$26.6926.7% undervalued
44 followersusers have followed this narrative
3 commentsusers have commented on this narrative
0 likesusers have liked this narrative
TI


TickerTickle on Oracle ·
The Quiet Giant That Became AI’s Power Grid
Fair Value:US$389.8147.4% undervalued
8 followersusers have followed this narrative
1 commentusers have commented on this narrative
0 likesusers have liked this narrative
Popular Narratives
OS

oscargarcia on Alphabet ·
The company that turned a verb into a global necessity and basically runs the modern internet, digital ads, smartphones, maps, and AI.
Fair Value:US$3405.9% undervalued
136 followersusers have followed this narrative
6 commentsusers have commented on this narrative
18 likesusers have liked this narrative
TH

TheWallstreetKing on MicroVision ·
MicroVision will explode future revenue by 380.37% with a vision towards success
Fair Value:US$6098.4% undervalued
89 followersusers have followed this narrative
11 commentsusers have commented on this narrative
18 likesusers have liked this narrative
AN


AnalystConsensusTarget on NVIDIA ·
NVDA: Expanding AI Demand Will Drive Major Data Center Investments Through 2026
Fair Value:US$232.7922.6% undervalued
926 followersusers have followed this narrative
6 commentsusers have commented on this narrative
22 likesusers have liked this narrative