- Hong Kong
- /
- Semiconductors
- /
- SEHK:1385
The 66% return delivered to Shanghai Fudan Microelectronics Group's (HKG:1385) shareholders actually lagged YoY earnings growth


Stock pickers are generally looking for stocks that will outperform the broader market. And the truth is, you can make significant gains if you buy good quality businesses at the right price. For example, the Shanghai Fudan Microelectronics Group Company Limited (HKG:1385) share price is up 63% in the last 5 years, clearly besting the market decline of around 12% (ignoring dividends).
On the back of a solid 7-day performance, let's check what role the company's fundamentals have played in driving long term shareholder returns.
See our latest analysis for Shanghai Fudan Microelectronics Group
To paraphrase Benjamin Graham: Over the short term the market is a voting machine, but over the long term it's a weighing machine. By comparing earnings per share (EPS) and share price changes over time, we can get a feel for how investor attitudes to a company have morphed over time.
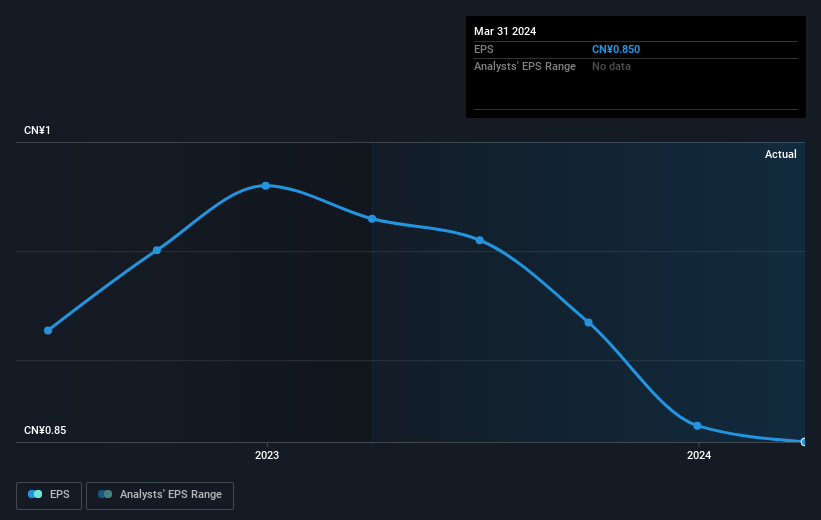
Over half a decade, Shanghai Fudan Microelectronics Group managed to grow its earnings per share at 105% a year. The EPS growth is more impressive than the yearly share price gain of 10% over the same period. So it seems the market isn't so enthusiastic about the stock these days.
The image below shows how EPS has tracked over time (if you click on the image you can see greater detail).
We know that Shanghai Fudan Microelectronics Group has improved its bottom line over the last three years, but what does the future have in store? If you are thinking of buying or selling Shanghai Fudan Microelectronics Group stock, you should check out this FREE detailed report on its balance sheet.
What About Dividends?
It is important to consider the total shareholder return, as well as the share price return, for any given stock. Whereas the share price return only reflects the change in the share price, the TSR includes the value of dividends (assuming they were reinvested) and the benefit of any discounted capital raising or spin-off. It's fair to say that the TSR gives a more complete picture for stocks that pay a dividend. In the case of Shanghai Fudan Microelectronics Group, it has a TSR of 66% for the last 5 years. That exceeds its share price return that we previously mentioned. And there's no prize for guessing that the dividend payments largely explain the divergence!
A Different Perspective
Shanghai Fudan Microelectronics Group shareholders are down 40% for the year (even including dividends), but the market itself is up 6.4%. However, keep in mind that even the best stocks will sometimes underperform the market over a twelve month period. Longer term investors wouldn't be so upset, since they would have made 11%, each year, over five years. If the fundamental data continues to indicate long term sustainable growth, the current sell-off could be an opportunity worth considering. It's always interesting to track share price performance over the longer term. But to understand Shanghai Fudan Microelectronics Group better, we need to consider many other factors. Case in point: We've spotted 2 warning signs for Shanghai Fudan Microelectronics Group you should be aware of, and 1 of them is a bit concerning.
For those who like to find winning investments this free list of undervalued companies with recent insider purchasing, could be just the ticket.
Please note, the market returns quoted in this article reflect the market weighted average returns of stocks that currently trade on Hong Kong exchanges.
New: Manage All Your Stock Portfolios in One Place
We've created the ultimate portfolio companion for stock investors, and it's free.
• Connect an unlimited number of Portfolios and see your total in one currency
• Be alerted to new Warning Signs or Risks via email or mobile
• Track the Fair Value of your stocks
Have feedback on this article? Concerned about the content? Get in touch with us directly. Alternatively, email editorial-team (at) simplywallst.com.
This article by Simply Wall St is general in nature. We provide commentary based on historical data and analyst forecasts only using an unbiased methodology and our articles are not intended to be financial advice. It does not constitute a recommendation to buy or sell any stock, and does not take account of your objectives, or your financial situation. We aim to bring you long-term focused analysis driven by fundamental data. Note that our analysis may not factor in the latest price-sensitive company announcements or qualitative material. Simply Wall St has no position in any stocks mentioned.
Have feedback on this article? Concerned about the content? Get in touch with us directly. Alternatively, email editorial-team@simplywallst.com
About SEHK:1385
Shanghai Fudan Microelectronics Group
Engages in the design, development, and sale of integrated circuit products and total solutions in Mainland China and internationally.
Excellent balance sheet with reasonable growth potential.
