- Hong Kong
- /
- Specialty Stores
- /
- SEHK:9992
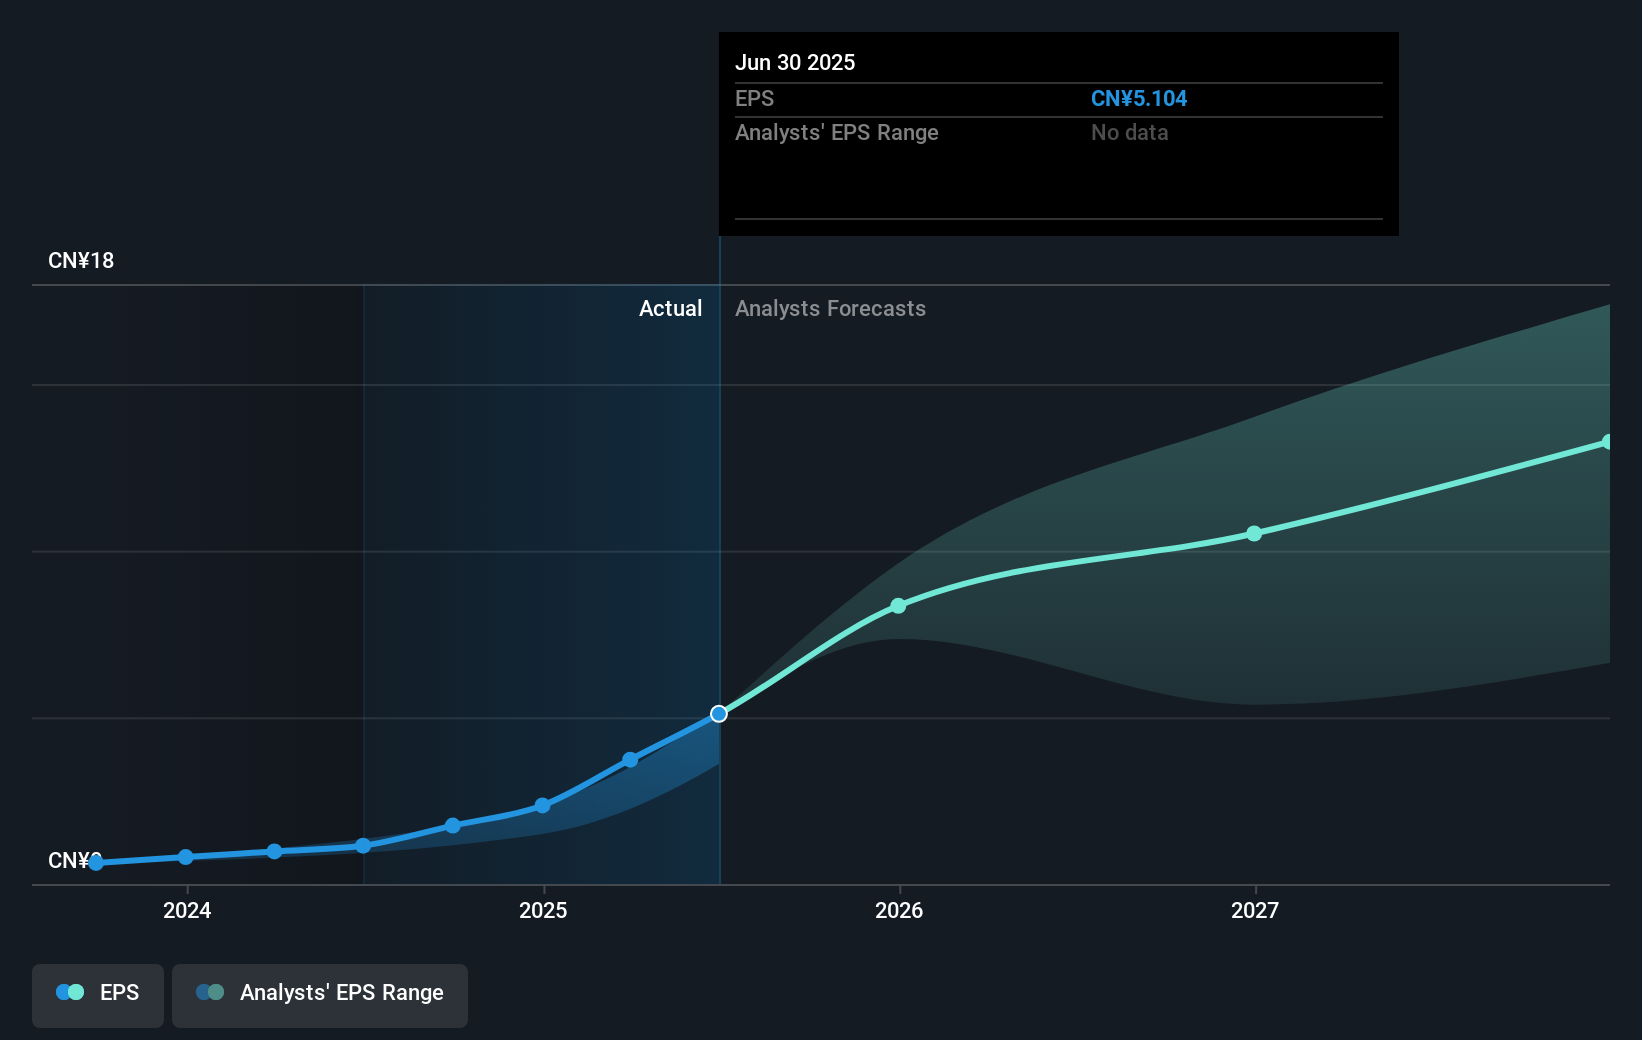
Pop Mart International Group (SEHK:9992) Reports Impressive Year-Over-Year Sales And Net Income Gains

Reviewed by Simply Wall St
Pop Mart International Group (SEHK:9992) saw its shares rise by 3.15% over the last quarter, a period marked by key developments like its inclusion in both the Hang Seng Index and the Hang Seng China Enterprises Index on September 8, 2025. This addition underscores the company's growing prominence following impressive financial results reported on August 19, 2025, which showed significant year-over-year gains in sales and net income. During this time, major indices like the S&P 500 and Nasdaq also hit all-time highs, meaning Pop Mart International's price move is consistent with broader market trends of growth and strong financial outcomes.
Over a three-year period, Pop Mart International Group achieved a total shareholder return of 1415.25%, a very large gain bolstering investor confidence. In the last year, the company outperformed both the Hong Kong Specialty Retail industry, which returned 212.3%, and the broader Hong Kong market, demonstrating its substantial growth momentum.
The company's inclusion in major indices and its strong financial results suggest positive implications for future revenue and earnings forecasts. The revenue surge and elevated net income, as reported, may support optimistic growth expectations. Although the current share price of HK$275.20 represents a movement aligned with broader market trends, it still reflects a 31.82% discount to the consensus analyst price target of approximately HK$362.78, highlighting potential for further upward adjustment.
This article by Simply Wall St is general in nature. We provide commentary based on historical data and analyst forecasts only using an unbiased methodology and our articles are not intended to be financial advice. It does not constitute a recommendation to buy or sell any stock, and does not take account of your objectives, or your financial situation. We aim to bring you long-term focused analysis driven by fundamental data. Note that our analysis may not factor in the latest price-sensitive company announcements or qualitative material. Simply Wall St has no position in any stocks mentioned.
New: Manage All Your Stock Portfolios in One Place
We've created the ultimate portfolio companion for stock investors, and it's free.
• Connect an unlimited number of Portfolios and see your total in one currency
• Be alerted to new Warning Signs or Risks via email or mobile
• Track the Fair Value of your stocks
Have feedback on this article? Concerned about the content? Get in touch with us directly. Alternatively, email editorial-team@simplywallst.com
About SEHK:9992
Pop Mart International Group
An investment holding company, engages in the design, development, and sale of pop toys in the People’s Republic of China, Hong Kong, Macao, Taiwan, and internationally.
Exceptional growth potential with outstanding track record.
Similar Companies
Market Insights

Community Narratives


Recently Updated Narratives


Alphabet: The Under-appreciated Compounder Hiding in Plain Sight


MINISO's fair value is projected at 26.69 with an anticipated PE ratio shift of 20x


The Quiet Giant That Became AI’s Power Grid
Popular Narratives

The company that turned a verb into a global necessity and basically runs the modern internet, digital ads, smartphones, maps, and AI.

MicroVision will explode future revenue by 380.37% with a vision towards success

