
Advertisement
- Hong Kong
- /
- Specialty Stores
- /
- SEHK:3836
Investors in China Harmony Auto Holding (HKG:3836) have unfortunately lost 56% over the last five years
We think intelligent long term investing is the way to go. But unfortunately, some companies simply don't succeed. To wit, the China Harmony Auto Holding Limited (HKG:3836) share price managed to fall 65% over five long years. That's not a lot of fun for true believers. More recently, the share price has dropped a further 23% in a month.
Now let's have a look at the company's fundamentals, and see if the long term shareholder return has matched the performance of the underlying business.
Given that China Harmony Auto Holding didn't make a profit in the last twelve months, we'll focus on revenue growth to form a quick view of its business development. Generally speaking, companies without profits are expected to grow revenue every year, and at a good clip. As you can imagine, fast revenue growth, when maintained, often leads to fast profit growth.
In the last half decade, China Harmony Auto Holding saw its revenue increase by 1.6% per year. That's not a very high growth rate considering it doesn't make profits. It's likely this weak growth has contributed to an annualised return of 11% for the last five years. We want to see an acceleration of revenue growth (or profits) before showing much interest in this one. When a stock falls hard like this, some investors like to add the company to a watchlist (in case the business recovers, longer term).
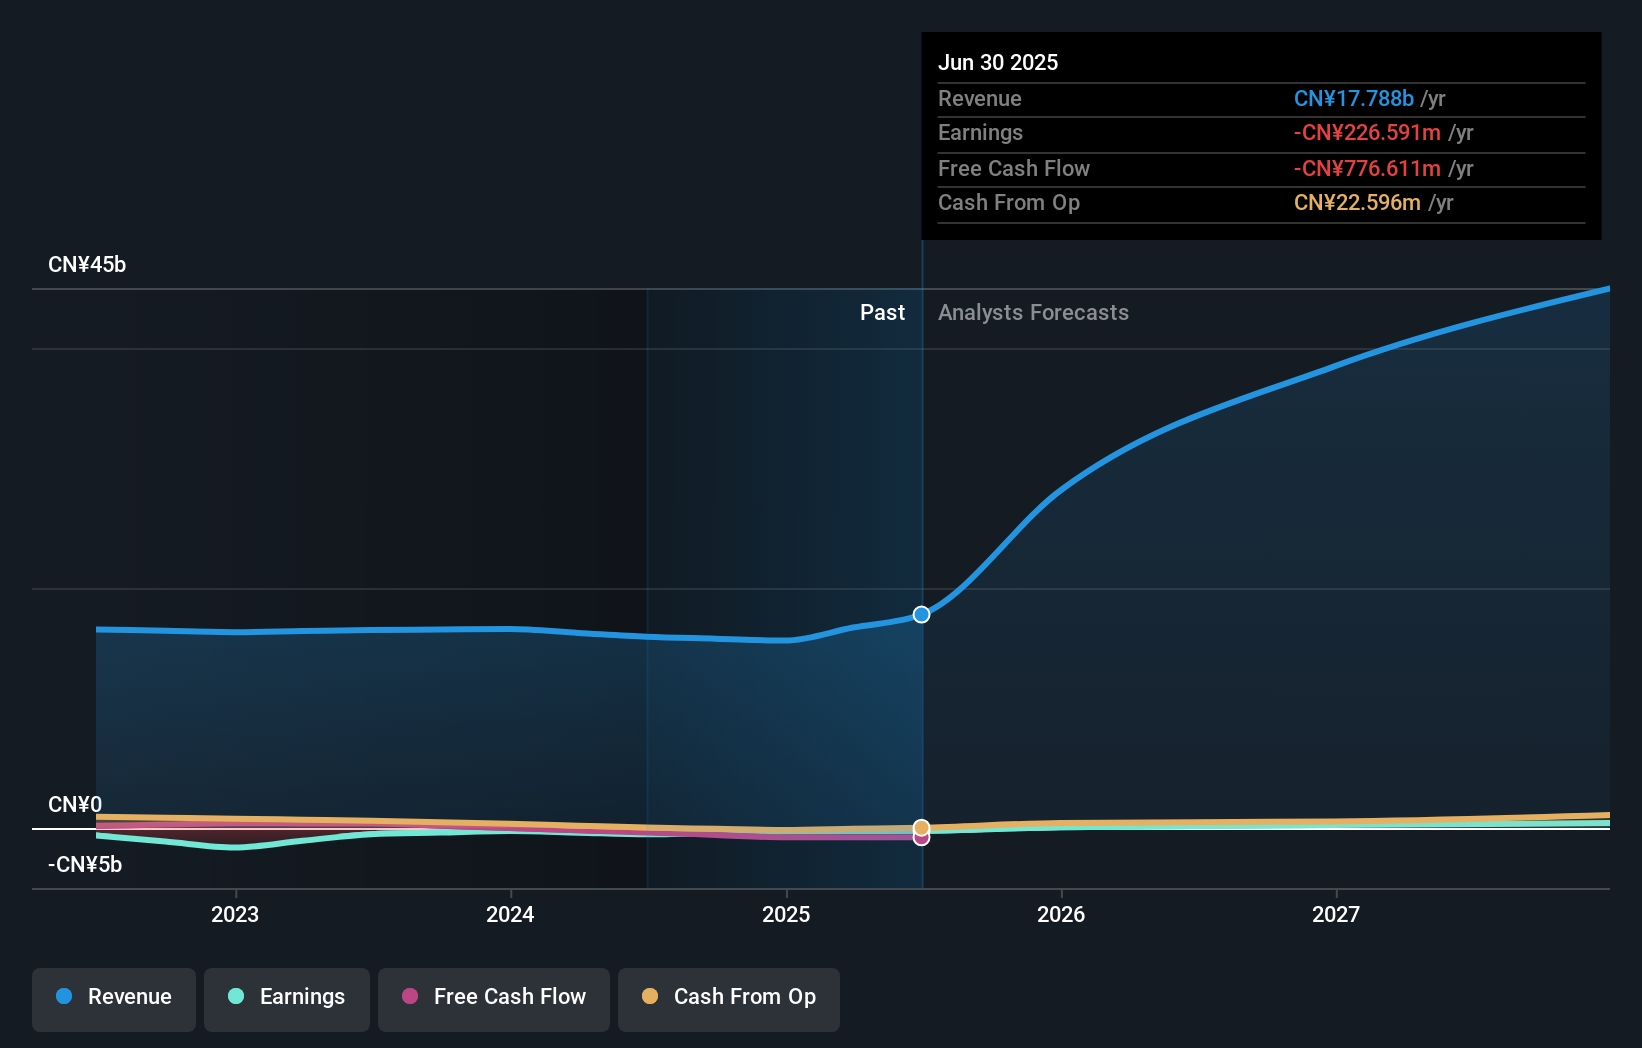
You can see how earnings and revenue have changed over time in the image below (click on the chart to see the exact values).
We're pleased to report that the CEO is remunerated more modestly than most CEOs at similarly capitalized companies. But while CEO remuneration is always worth checking, the really important question is whether the company can grow earnings going forward. This free report showing analyst forecasts should help you form a view on China Harmony Auto Holding
A Dividend Lost
It's important to keep in mind that we've been talking about the share price returns, which don't include dividends, while the total shareholder return does. By accounting for the value of dividends paid, the TSR can be seen as a more complete measure of the value a company brings to its shareholders. Over the last 5 years, China Harmony Auto Holding generated a TSR of -56%, which is, of course, better than the share price return. Although the company had to cut dividends, it has paid cash to shareholders in the past.
A Different Perspective
It's nice to see that China Harmony Auto Holding shareholders have received a total shareholder return of 48% over the last year. That certainly beats the loss of about 9% per year over the last half decade. We generally put more weight on the long term performance over the short term, but the recent improvement could hint at a (positive) inflection point within the business. I find it very interesting to look at share price over the long term as a proxy for business performance. But to truly gain insight, we need to consider other information, too. Consider for instance, the ever-present spectre of investment risk. We've identified 2 warning signs with China Harmony Auto Holding , and understanding them should be part of your investment process.
If you would prefer to check out another company -- one with potentially superior financials -- then do not miss this free list of companies that have proven they can grow earnings.
Please note, the market returns quoted in this article reflect the market weighted average returns of stocks that currently trade on Hong Kong exchanges.
New: AI Stock Screener & Alerts
Our new AI Stock Screener scans the market every day to uncover opportunities.
• Dividend Powerhouses (3%+ Yield)
• Undervalued Small Caps with Insider Buying
• High growth Tech and AI Companies
Or build your own from over 50 metrics.
Have feedback on this article? Concerned about the content? Get in touch with us directly. Alternatively, email editorial-team (at) simplywallst.com.
This article by Simply Wall St is general in nature. We provide commentary based on historical data and analyst forecasts only using an unbiased methodology and our articles are not intended to be financial advice. It does not constitute a recommendation to buy or sell any stock, and does not take account of your objectives, or your financial situation. We aim to bring you long-term focused analysis driven by fundamental data. Note that our analysis may not factor in the latest price-sensitive company announcements or qualitative material. Simply Wall St has no position in any stocks mentioned.
About SEHK:3836
China Harmony Auto Holding
An investment holding company, engages in the sale of automobiles in Mainland China, Hong Kong, and internationally.
High growth potential and fair value.
Market Insights

Advertisement
Community Narratives
The company that turned a verb into a global necessity and basically runs the modern internet, digital ads, smartphones, maps, and AI.
Fair Value US$300.00|5.2% undervalued
OS
Community Contributor
Flowers Foods Pays A Fair Price For Health
Fair Value US$16.12|24.9% undervalued
NV
Community Contributor
TMX Group will thrive with 33.3% profit margin and enduring market moat
Fair Value CA$49.90|3.3% overvalued
LI
Community Contributor
The "Molecular Pencil": Why Beam's Technology is Built to Win
Fair Value US$65.01|64.5% undervalued
DA
Community Contributor