
Advertisement
The external fund manager backed by Berkshire Hathaway's Charlie Munger, Li Lu, makes no bones about it when he says 'The biggest investment risk is not the volatility of prices, but whether you will suffer a permanent loss of capital.' When we think about how risky a company is, we always like to look at its use of debt, since debt overload can lead to ruin. We can see that Zibuyu Group Limited (HKG:2420) does use debt in its business. But the real question is whether this debt is making the company risky.
Why Does Debt Bring Risk?
Debt and other liabilities become risky for a business when it cannot easily fulfill those obligations, either with free cash flow or by raising capital at an attractive price. Part and parcel of capitalism is the process of 'creative destruction' where failed businesses are mercilessly liquidated by their bankers. However, a more common (but still painful) scenario is that it has to raise new equity capital at a low price, thus permanently diluting shareholders. Of course, the upside of debt is that it often represents cheap capital, especially when it replaces dilution in a company with the ability to reinvest at high rates of return. The first step when considering a company's debt levels is to consider its cash and debt together.
View our latest analysis for Zibuyu Group
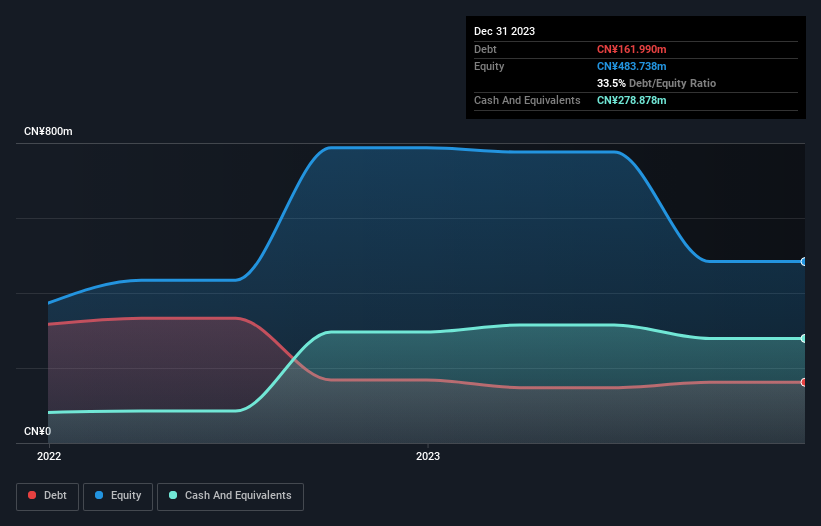
What Is Zibuyu Group's Net Debt?
As you can see below, Zibuyu Group had CN¥162.0m of debt, at December 2023, which is about the same as the year before. You can click the chart for greater detail. But on the other hand it also has CN¥278.9m in cash, leading to a CN¥116.9m net cash position.
How Healthy Is Zibuyu Group's Balance Sheet?
According to the last reported balance sheet, Zibuyu Group had liabilities of CN¥399.3m due within 12 months, and liabilities of CN¥10.4m due beyond 12 months. Offsetting this, it had CN¥278.9m in cash and CN¥151.4m in receivables that were due within 12 months. So it actually has CN¥20.6m more liquid assets than total liabilities.
This state of affairs indicates that Zibuyu Group's balance sheet looks quite solid, as its total liabilities are just about equal to its liquid assets. So it's very unlikely that the CN¥1.55b company is short on cash, but still worth keeping an eye on the balance sheet. Simply put, the fact that Zibuyu Group has more cash than debt is arguably a good indication that it can manage its debt safely. When analysing debt levels, the balance sheet is the obvious place to start. But it is future earnings, more than anything, that will determine Zibuyu Group's ability to maintain a healthy balance sheet going forward. So if you want to see what the professionals think, you might find this free report on analyst profit forecasts to be interesting.
Over 12 months, Zibuyu Group made a loss at the EBIT level, and saw its revenue drop to CN¥3.0b, which is a fall of 2.2%. We would much prefer see growth.
So How Risky Is Zibuyu Group?
While Zibuyu Group lost money on an earnings before interest and tax (EBIT) level, it actually generated positive free cash flow CN¥70m. So although it is loss-making, it doesn't seem to have too much near-term balance sheet risk, keeping in mind the net cash. With mediocre revenue growth in the last year, we're don't find the investment opportunity particularly compelling. When analysing debt levels, the balance sheet is the obvious place to start. But ultimately, every company can contain risks that exist outside of the balance sheet. These risks can be hard to spot. Every company has them, and we've spotted 1 warning sign for Zibuyu Group you should know about.
At the end of the day, it's often better to focus on companies that are free from net debt. You can access our special list of such companies (all with a track record of profit growth). It's free.
Valuation is complex, but we're here to simplify it.
Discover if Zibuyu Group might be undervalued or overvalued with our detailed analysis, featuring fair value estimates, potential risks, dividends, insider trades, and its financial condition.
Access Free AnalysisHave feedback on this article? Concerned about the content? Get in touch with us directly. Alternatively, email editorial-team (at) simplywallst.com.
This article by Simply Wall St is general in nature. We provide commentary based on historical data and analyst forecasts only using an unbiased methodology and our articles are not intended to be financial advice. It does not constitute a recommendation to buy or sell any stock, and does not take account of your objectives, or your financial situation. We aim to bring you long-term focused analysis driven by fundamental data. Note that our analysis may not factor in the latest price-sensitive company announcements or qualitative material. Simply Wall St has no position in any stocks mentioned.
About SEHK:2420
Zibuyu Group
An investment holding company, operates as a cross-border e-commerce company in China.
Undervalued with excellent balance sheet.
Market Insights

Advertisement
Community Narratives
MINISO's fair value is projected at 26.69 with an anticipated PE ratio shift of 20x
Fair Value US$24.03|11.0% undervalued
BE
Community Contributor
Procter & Gamble: A Dividend Giant Facing Slowing Growth
Fair Value US$119.81|23.3% overvalued
AN
Community Contributor
Eli Lilly's Future Growth Driven by Tirzepatide and Favorable Market Conditions
Fair Value US$1.19k|13.8% undervalued
EA
Community Contributor