- Hong Kong
- /
- Real Estate
- /
- SEHK:1663
Sino Harbour Holdings Group (HKG:1663) Share Prices Have Dropped 81% In The Last Five Years
It is a pleasure to report that the Sino Harbour Holdings Group Limited (HKG:1663) is up 35% in the last quarter. But will that repair the damage for the weary investors who have owned this stock as it declined over half a decade? Probably not. Five years have seen the share price descend precipitously, down a full 81%. The recent bounce might mean the long decline is over, but we are not confident. The real question is whether the business can leave its past behind and improve itself over the years ahead.
While a drop like that is definitely a body blow, money isn't as important as health and happiness.
Check out our latest analysis for Sino Harbour Holdings Group
To paraphrase Benjamin Graham: Over the short term the market is a voting machine, but over the long term it's a weighing machine. One flawed but reasonable way to assess how sentiment around a company has changed is to compare the earnings per share (EPS) with the share price.
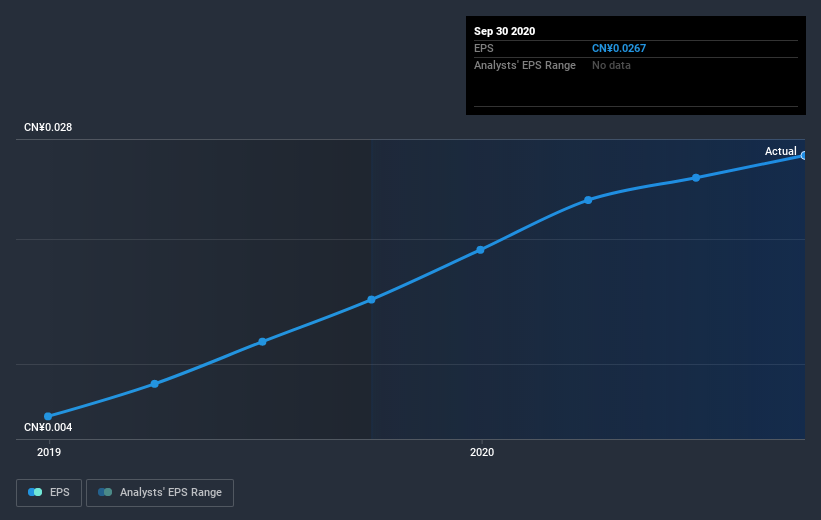
During the five years over which the share price declined, Sino Harbour Holdings Group's earnings per share (EPS) dropped by 8.1% each year. Readers should note that the share price has fallen faster than the EPS, at a rate of 29% per year, over the period. So it seems the market was too confident about the business, in the past. The less favorable sentiment is reflected in its current P/E ratio of 4.85.
The image below shows how EPS has tracked over time (if you click on the image you can see greater detail).

It's good to see that there was some significant insider buying in the last three months. That's a positive. On the other hand, we think the revenue and earnings trends are much more meaningful measures of the business. This free interactive report on Sino Harbour Holdings Group's earnings, revenue and cash flow is a great place to start, if you want to investigate the stock further.
What About Dividends?
It is important to consider the total shareholder return, as well as the share price return, for any given stock. The TSR incorporates the value of any spin-offs or discounted capital raisings, along with any dividends, based on the assumption that the dividends are reinvested. Arguably, the TSR gives a more comprehensive picture of the return generated by a stock. As it happens, Sino Harbour Holdings Group's TSR for the last 5 years was -78%, which exceeds the share price return mentioned earlier. And there's no prize for guessing that the dividend payments largely explain the divergence!
A Different Perspective
It's good to see that Sino Harbour Holdings Group has rewarded shareholders with a total shareholder return of 20% in the last twelve months. And that does include the dividend. That certainly beats the loss of about 12% per year over the last half decade. The long term loss makes us cautious, but the short term TSR gain certainly hints at a brighter future. It's always interesting to track share price performance over the longer term. But to understand Sino Harbour Holdings Group better, we need to consider many other factors. For instance, we've identified 4 warning signs for Sino Harbour Holdings Group (1 shouldn't be ignored) that you should be aware of.
There are plenty of other companies that have insiders buying up shares. You probably do not want to miss this free list of growing companies that insiders are buying.
Please note, the market returns quoted in this article reflect the market weighted average returns of stocks that currently trade on HK exchanges.
If you decide to trade Sino Harbour Holdings Group, use the lowest-cost* platform that is rated #1 Overall by Barron’s, Interactive Brokers. Trade stocks, options, futures, forex, bonds and funds on 135 markets, all from a single integrated account. Promoted
New: Manage All Your Stock Portfolios in One Place
We've created the ultimate portfolio companion for stock investors, and it's free.
• Connect an unlimited number of Portfolios and see your total in one currency
• Be alerted to new Warning Signs or Risks via email or mobile
• Track the Fair Value of your stocks
This article by Simply Wall St is general in nature. It does not constitute a recommendation to buy or sell any stock, and does not take account of your objectives, or your financial situation. We aim to bring you long-term focused analysis driven by fundamental data. Note that our analysis may not factor in the latest price-sensitive company announcements or qualitative material. Simply Wall St has no position in any stocks mentioned.
*Interactive Brokers Rated Lowest Cost Broker by StockBrokers.com Annual Online Review 2020
Have feedback on this article? Concerned about the content? Get in touch with us directly. Alternatively, email editorial-team (at) simplywallst.com.
About SEHK:1663
Sino Harbour Holdings Group
An investment holding company, engages in the development of properties in the People’s Republic of China.
Excellent balance sheet and good value.
Market Insights
Community Narratives


Recently Updated Narratives

Astor Enerji will surge with a fair value of $140.43 in the next 3 years

Proximus: The State-Backed Backup Plan with 7% Gross Yield and 15% Currency Upside.


A case for for IMPACT Silver Corp (TSXV:IPT) to reach USD $4.52 (CAD $6.16) in 2026 (23 bagger in 1 year) and USD $5.76 (CAD $7.89) by 2030
Popular Narratives


MicroVision will explode future revenue by 380.37% with a vision towards success


The company that turned a verb into a global necessity and basically runs the modern internet, digital ads, smartphones, maps, and AI.


