
Advertisement
- Hong Kong
- /
- Real Estate
- /
- SEHK:989
Market Participants Recognise China Changbaishan International Holdings Limited's (HKG:989) Revenues Pushing Shares 27% Higher
China Changbaishan International Holdings Limited (HKG:989) shares have had a really impressive month, gaining 27% after a shaky period beforehand. Taking a wider view, although not as strong as the last month, the full year gain of 21% is also fairly reasonable.
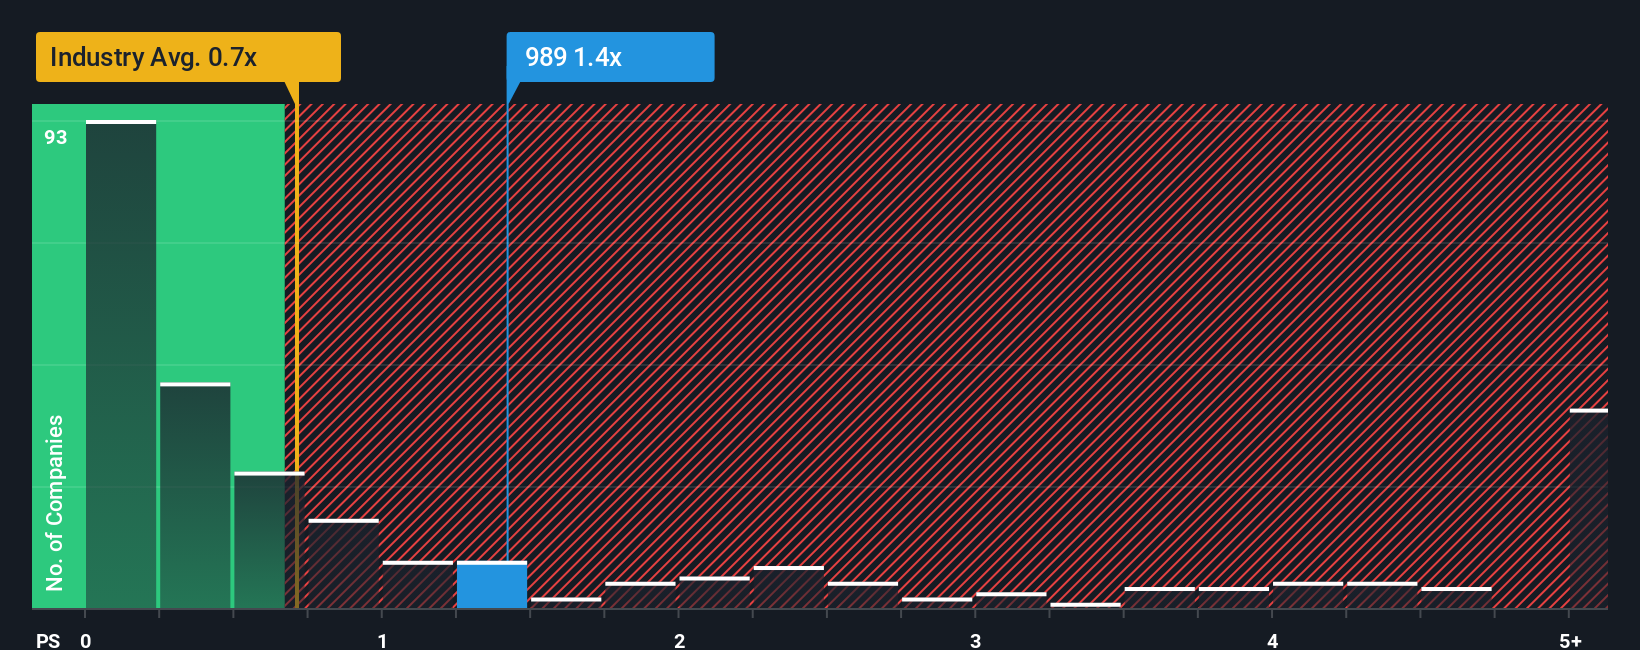
Since its price has surged higher, you could be forgiven for thinking China Changbaishan International Holdings is a stock not worth researching with a price-to-sales ratios (or "P/S") of 1.4x, considering almost half the companies in Hong Kong's Real Estate industry have P/S ratios below 0.7x. However, the P/S might be high for a reason and it requires further investigation to determine if it's justified.
Check out our latest analysis for China Changbaishan International Holdings
How China Changbaishan International Holdings Has Been Performing
Recent times have been quite advantageous for China Changbaishan International Holdings as its revenue has been rising very briskly. It seems that many are expecting the strong revenue performance to beat most other companies over the coming period, which has increased investors’ willingness to pay up for the stock. If not, then existing shareholders might be a little nervous about the viability of the share price.
Although there are no analyst estimates available for China Changbaishan International Holdings, take a look at this free data-rich visualisation to see how the company stacks up on earnings, revenue and cash flow.How Is China Changbaishan International Holdings' Revenue Growth Trending?
There's an inherent assumption that a company should outperform the industry for P/S ratios like China Changbaishan International Holdings' to be considered reasonable.
Taking a look back first, we see that the company grew revenue by an impressive 61% last year. The strong recent performance means it was also able to grow revenue by 66% in total over the last three years. Accordingly, shareholders would have definitely welcomed those medium-term rates of revenue growth.
Comparing that to the industry, which is only predicted to deliver 5.3% growth in the next 12 months, the company's momentum is stronger based on recent medium-term annualised revenue results.
With this in consideration, it's not hard to understand why China Changbaishan International Holdings' P/S is high relative to its industry peers. Presumably shareholders aren't keen to offload something they believe will continue to outmanoeuvre the wider industry.
The Final Word
China Changbaishan International Holdings shares have taken a big step in a northerly direction, but its P/S is elevated as a result. It's argued the price-to-sales ratio is an inferior measure of value within certain industries, but it can be a powerful business sentiment indicator.
It's no surprise that China Changbaishan International Holdings can support its high P/S given the strong revenue growth its experienced over the last three-year is superior to the current industry outlook. At this stage investors feel the potential continued revenue growth in the future is great enough to warrant an inflated P/S. If recent medium-term revenue trends continue, it's hard to see the share price falling strongly in the near future under these circumstances.
Before you take the next step, you should know about the 4 warning signs for China Changbaishan International Holdings (3 are a bit unpleasant!) that we have uncovered.
If companies with solid past earnings growth is up your alley, you may wish to see this free collection of other companies with strong earnings growth and low P/E ratios.
New: AI Stock Screener & Alerts
Our new AI Stock Screener scans the market every day to uncover opportunities.
• Dividend Powerhouses (3%+ Yield)
• Undervalued Small Caps with Insider Buying
• High growth Tech and AI Companies
Or build your own from over 50 metrics.
Have feedback on this article? Concerned about the content? Get in touch with us directly. Alternatively, email editorial-team (at) simplywallst.com.
This article by Simply Wall St is general in nature. We provide commentary based on historical data and analyst forecasts only using an unbiased methodology and our articles are not intended to be financial advice. It does not constitute a recommendation to buy or sell any stock, and does not take account of your objectives, or your financial situation. We aim to bring you long-term focused analysis driven by fundamental data. Note that our analysis may not factor in the latest price-sensitive company announcements or qualitative material. Simply Wall St has no position in any stocks mentioned.
About SEHK:989
China Changbaishan International Holdings
An investment holding company, engages in the property development and management business in the People’s Republic of China.
Slight risk with weak fundamentals.
Market Insights

Advertisement
Community Narratives
The company that turned a verb into a global necessity and basically runs the modern internet, digital ads, smartphones, maps, and AI.
Fair Value US$300.00|7.5% undervalued
OS
Community Contributor
Flowers Foods Pays A Fair Price For Health
Fair Value US$16.12|25.4% undervalued
NV
Community Contributor
TMX Group will thrive with 33.3% profit margin and enduring market moat
Fair Value CA$49.90|3.6% overvalued
LI
Community Contributor
The "Molecular Pencil": Why Beam's Technology is Built to Win
Fair Value US$65.01|65.0% undervalued
DA
Community Contributor