- Hong Kong
- /
- Real Estate
- /
- SEHK:960
Longfor Group Holdings (HKG:960) stock falls 4.3% in past week as three-year earnings and shareholder returns continue downward trend


If you love investing in stocks you're bound to buy some losers. But the last three years have been particularly tough on longer term Longfor Group Holdings Limited (HKG:960) shareholders. Regrettably, they have had to cope with a 75% drop in the share price over that period. And more recent buyers are having a tough time too, with a drop of 43% in the last year. The falls have accelerated recently, with the share price down 39% in the last three months.
After losing 4.3% this past week, it's worth investigating the company's fundamentals to see what we can infer from past performance.
See our latest analysis for Longfor Group Holdings
To paraphrase Benjamin Graham: Over the short term the market is a voting machine, but over the long term it's a weighing machine. One way to examine how market sentiment has changed over time is to look at the interaction between a company's share price and its earnings per share (EPS).
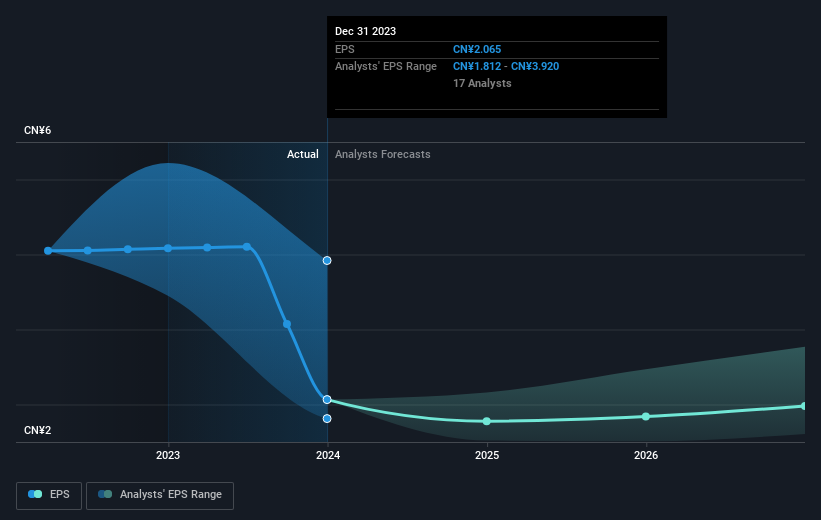
During the three years that the share price fell, Longfor Group Holdings' earnings per share (EPS) dropped by 18% each year. The share price decline of 37% is actually steeper than the EPS slippage. So it seems the market was too confident about the business, in the past. This increased caution is also evident in the rather low P/E ratio, which is sitting at 4.40.
The company's earnings per share (over time) is depicted in the image below (click to see the exact numbers).
We like that insiders have been buying shares in the last twelve months. Even so, future earnings will be far more important to whether current shareholders make money. This free interactive report on Longfor Group Holdings' earnings, revenue and cash flow is a great place to start, if you want to investigate the stock further.
What About Dividends?
It is important to consider the total shareholder return, as well as the share price return, for any given stock. The TSR is a return calculation that accounts for the value of cash dividends (assuming that any dividend received was reinvested) and the calculated value of any discounted capital raisings and spin-offs. It's fair to say that the TSR gives a more complete picture for stocks that pay a dividend. As it happens, Longfor Group Holdings' TSR for the last 3 years was -70%, which exceeds the share price return mentioned earlier. And there's no prize for guessing that the dividend payments largely explain the divergence!
A Different Perspective
Longfor Group Holdings shareholders are down 40% for the year (even including dividends), but the market itself is up 8.0%. Even the share prices of good stocks drop sometimes, but we want to see improvements in the fundamental metrics of a business, before getting too interested. Regrettably, last year's performance caps off a bad run, with the shareholders facing a total loss of 10% per year over five years. We realise that Baron Rothschild has said investors should "buy when there is blood on the streets", but we caution that investors should first be sure they are buying a high quality business. While it is well worth considering the different impacts that market conditions can have on the share price, there are other factors that are even more important. Consider for instance, the ever-present spectre of investment risk. We've identified 3 warning signs with Longfor Group Holdings (at least 1 which makes us a bit uncomfortable) , and understanding them should be part of your investment process.
If you like to buy stocks alongside management, then you might just love this free list of companies. (Hint: most of them are flying under the radar).
Please note, the market returns quoted in this article reflect the market weighted average returns of stocks that currently trade on Hong Kong exchanges.
New: AI Stock Screener & Alerts
Our new AI Stock Screener scans the market every day to uncover opportunities.
• Dividend Powerhouses (3%+ Yield)
• Undervalued Small Caps with Insider Buying
• High growth Tech and AI Companies
Or build your own from over 50 metrics.
Have feedback on this article? Concerned about the content? Get in touch with us directly. Alternatively, email editorial-team (at) simplywallst.com.
This article by Simply Wall St is general in nature. We provide commentary based on historical data and analyst forecasts only using an unbiased methodology and our articles are not intended to be financial advice. It does not constitute a recommendation to buy or sell any stock, and does not take account of your objectives, or your financial situation. We aim to bring you long-term focused analysis driven by fundamental data. Note that our analysis may not factor in the latest price-sensitive company announcements or qualitative material. Simply Wall St has no position in any stocks mentioned.
About SEHK:960
Longfor Group Holdings
An investment holding company, engages in the property development, investment, and management businesses in the People’s Republic of China.
Very undervalued with adequate balance sheet and pays a dividend.

