
Advertisement
- Hong Kong
- /
- Real Estate
- /
- SEHK:8067
Is Oriental University City Holdings (H.K.) (HKG:8067) Using Too Much Debt?
Howard Marks put it nicely when he said that, rather than worrying about share price volatility, 'The possibility of permanent loss is the risk I worry about... and every practical investor I know worries about.' So it might be obvious that you need to consider debt, when you think about how risky any given stock is, because too much debt can sink a company. We note that Oriental University City Holdings (H.K.) Limited (HKG:8067) does have debt on its balance sheet. But should shareholders be worried about its use of debt?
When Is Debt Dangerous?
Debt assists a business until the business has trouble paying it off, either with new capital or with free cash flow. Ultimately, if the company can't fulfill its legal obligations to repay debt, shareholders could walk away with nothing. However, a more frequent (but still costly) occurrence is where a company must issue shares at bargain-basement prices, permanently diluting shareholders, just to shore up its balance sheet. By replacing dilution, though, debt can be an extremely good tool for businesses that need capital to invest in growth at high rates of return. The first thing to do when considering how much debt a business uses is to look at its cash and debt together.
View our latest analysis for Oriental University City Holdings (H.K.)
How Much Debt Does Oriental University City Holdings (H.K.) Carry?
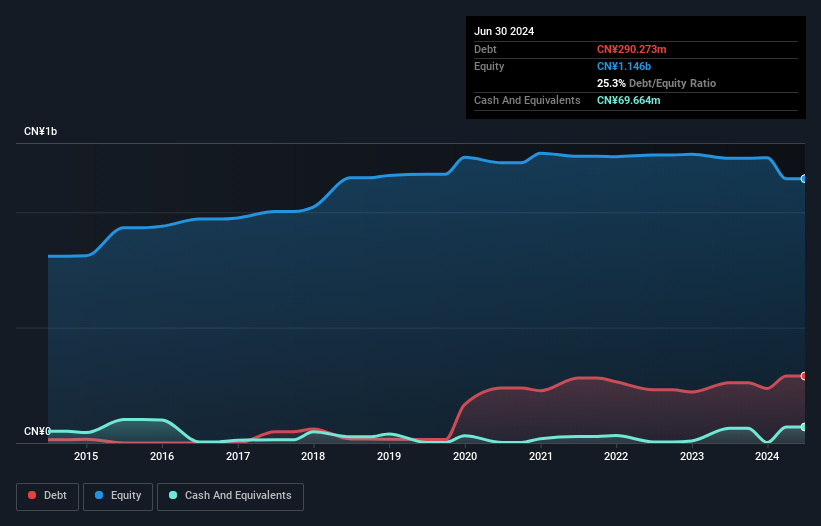
As you can see below, at the end of June 2024, Oriental University City Holdings (H.K.) had CN¥290.3m of debt, up from CN¥261.5m a year ago. Click the image for more detail. However, it also had CN¥69.7m in cash, and so its net debt is CN¥220.6m.
A Look At Oriental University City Holdings (H.K.)'s Liabilities
Zooming in on the latest balance sheet data, we can see that Oriental University City Holdings (H.K.) had liabilities of CN¥210.5m due within 12 months and liabilities of CN¥444.8m due beyond that. On the other hand, it had cash of CN¥69.7m and CN¥24.0m worth of receivables due within a year. So its liabilities total CN¥561.7m more than the combination of its cash and short-term receivables.
This deficit casts a shadow over the CN¥65.6m company, like a colossus towering over mere mortals. So we'd watch its balance sheet closely, without a doubt. At the end of the day, Oriental University City Holdings (H.K.) would probably need a major re-capitalization if its creditors were to demand repayment.
We use two main ratios to inform us about debt levels relative to earnings. The first is net debt divided by earnings before interest, tax, depreciation, and amortization (EBITDA), while the second is how many times its earnings before interest and tax (EBIT) covers its interest expense (or its interest cover, for short). The advantage of this approach is that we take into account both the absolute quantum of debt (with net debt to EBITDA) and the actual interest expenses associated with that debt (with its interest cover ratio).
Oriental University City Holdings (H.K.) shareholders face the double whammy of a high net debt to EBITDA ratio (10.0), and fairly weak interest coverage, since EBIT is just 1.3 times the interest expense. This means we'd consider it to have a heavy debt load. Even worse, Oriental University City Holdings (H.K.) saw its EBIT tank 27% over the last 12 months. If earnings continue to follow that trajectory, paying off that debt load will be harder than convincing us to run a marathon in the rain. The balance sheet is clearly the area to focus on when you are analysing debt. But you can't view debt in total isolation; since Oriental University City Holdings (H.K.) will need earnings to service that debt. So if you're keen to discover more about its earnings, it might be worth checking out this graph of its long term earnings trend.
Finally, a company can only pay off debt with cold hard cash, not accounting profits. So the logical step is to look at the proportion of that EBIT that is matched by actual free cash flow. Over the last three years, Oriental University City Holdings (H.K.) recorded free cash flow worth a fulsome 92% of its EBIT, which is stronger than we'd usually expect. That positions it well to pay down debt if desirable to do so.
Our View
To be frank both Oriental University City Holdings (H.K.)'s EBIT growth rate and its track record of staying on top of its total liabilities make us rather uncomfortable with its debt levels. But at least it's pretty decent at converting EBIT to free cash flow; that's encouraging. We're quite clear that we consider Oriental University City Holdings (H.K.) to be really rather risky, as a result of its balance sheet health. So we're almost as wary of this stock as a hungry kitten is about falling into its owner's fish pond: once bitten, twice shy, as they say. When analysing debt levels, the balance sheet is the obvious place to start. However, not all investment risk resides within the balance sheet - far from it. These risks can be hard to spot. Every company has them, and we've spotted 3 warning signs for Oriental University City Holdings (H.K.) (of which 2 don't sit too well with us!) you should know about.
If you're interested in investing in businesses that can grow profits without the burden of debt, then check out this free list of growing businesses that have net cash on the balance sheet.
New: AI Stock Screener & Alerts
Our new AI Stock Screener scans the market every day to uncover opportunities.
• Dividend Powerhouses (3%+ Yield)
• Undervalued Small Caps with Insider Buying
• High growth Tech and AI Companies
Or build your own from over 50 metrics.
Have feedback on this article? Concerned about the content? Get in touch with us directly. Alternatively, email editorial-team (at) simplywallst.com.
This article by Simply Wall St is general in nature. We provide commentary based on historical data and analyst forecasts only using an unbiased methodology and our articles are not intended to be financial advice. It does not constitute a recommendation to buy or sell any stock, and does not take account of your objectives, or your financial situation. We aim to bring you long-term focused analysis driven by fundamental data. Note that our analysis may not factor in the latest price-sensitive company announcements or qualitative material. Simply Wall St has no position in any stocks mentioned.
About SEHK:8067
Oriental University City Holdings (H.K.)
An investment holding company, leases education facilities in the People’s Republic of China, Malaysia, Indonesia, and Switzerland.
Low risk with worrying balance sheet.
Market Insights

Advertisement
Community Narratives
MicroVision will explode future revenue by 380.37% with a vision towards success
Fair Value US$60.00|98.3% undervalued
TH
Community Contributor
The Indispensable Artery for a New North American Economy
Fair Value CA$132.87|1.0% undervalued
TI
Community Contributor