
Advertisement
- Hong Kong
- /
- Real Estate
- /
- SEHK:6093
Hevol Services Group Co. Limited's (HKG:6093) Popularity With Investors Under Threat As Stock Sinks 27%
Unfortunately for some shareholders, the Hevol Services Group Co. Limited (HKG:6093) share price has dived 27% in the last thirty days, prolonging recent pain. The recent drop completes a disastrous twelve months for shareholders, who are sitting on a 57% loss during that time.
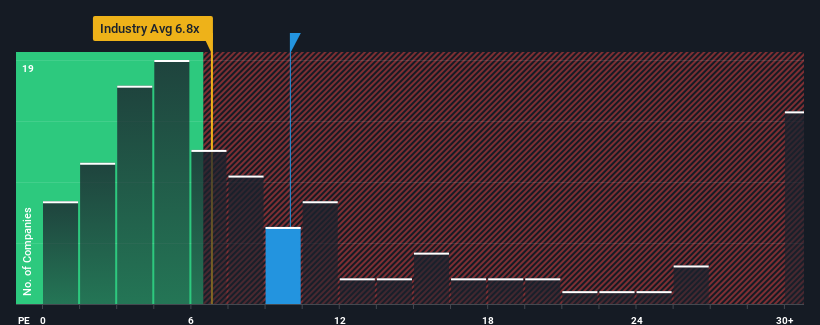
Although its price has dipped substantially, you could still be forgiven for feeling indifferent about Hevol Services Group's P/E ratio of 10x, since the median price-to-earnings (or "P/E") ratio in Hong Kong is also close to 9x. While this might not raise any eyebrows, if the P/E ratio is not justified investors could be missing out on a potential opportunity or ignoring looming disappointment.
The earnings growth achieved at Hevol Services Group over the last year would be more than acceptable for most companies. It might be that many expect the respectable earnings performance to wane, which has kept the P/E from rising. If that doesn't eventuate, then existing shareholders probably aren't too pessimistic about the future direction of the share price.
See our latest analysis for Hevol Services Group
What Are Growth Metrics Telling Us About The P/E?
The only time you'd be comfortable seeing a P/E like Hevol Services Group's is when the company's growth is tracking the market closely.
Taking a look back first, we see that the company managed to grow earnings per share by a handy 13% last year. The solid recent performance means it was also able to grow EPS by 9.0% in total over the last three years. Therefore, it's fair to say the earnings growth recently has been respectable for the company.
Weighing that recent medium-term earnings trajectory against the broader market's one-year forecast for expansion of 19% shows it's noticeably less attractive on an annualised basis.
In light of this, it's curious that Hevol Services Group's P/E sits in line with the majority of other companies. It seems most investors are ignoring the fairly limited recent growth rates and are willing to pay up for exposure to the stock. Maintaining these prices will be difficult to achieve as a continuation of recent earnings trends is likely to weigh down the shares eventually.
The Key Takeaway
Hevol Services Group's plummeting stock price has brought its P/E right back to the rest of the market. Typically, we'd caution against reading too much into price-to-earnings ratios when settling on investment decisions, though it can reveal plenty about what other market participants think about the company.
Our examination of Hevol Services Group revealed its three-year earnings trends aren't impacting its P/E as much as we would have predicted, given they look worse than current market expectations. Right now we are uncomfortable with the P/E as this earnings performance isn't likely to support a more positive sentiment for long. If recent medium-term earnings trends continue, it will place shareholders' investments at risk and potential investors in danger of paying an unnecessary premium.
The company's balance sheet is another key area for risk analysis. You can assess many of the main risks through our free balance sheet analysis for Hevol Services Group with six simple checks.
Of course, you might also be able to find a better stock than Hevol Services Group. So you may wish to see this free collection of other companies that have reasonable P/E ratios and have grown earnings strongly.
Valuation is complex, but we're here to simplify it.
Discover if Hevol Services Group might be undervalued or overvalued with our detailed analysis, featuring fair value estimates, potential risks, dividends, insider trades, and its financial condition.
Access Free AnalysisHave feedback on this article? Concerned about the content? Get in touch with us directly. Alternatively, email editorial-team (at) simplywallst.com.
This article by Simply Wall St is general in nature. We provide commentary based on historical data and analyst forecasts only using an unbiased methodology and our articles are not intended to be financial advice. It does not constitute a recommendation to buy or sell any stock, and does not take account of your objectives, or your financial situation. We aim to bring you long-term focused analysis driven by fundamental data. Note that our analysis may not factor in the latest price-sensitive company announcements or qualitative material. Simply Wall St has no position in any stocks mentioned.
About SEHK:6093
Hevol Services Group
An investment holding company, provides property management and value-added services in the People’s Republic of China.
Excellent balance sheet with moderate risk.
Similar Companies
Market Insights

Advertisement
Community Narratives
MicroVision will explode future revenue by 380.37% with a vision towards success
Fair Value US$60|98.4% undervalued
TH
Community Contributor
The Indispensable Artery for a New North American Economy
Fair Value CA$132.87|0.6% undervalued
TI
Community Contributor
Recently Updated Narratives
JO


JohnJ on Worldline ·
No miracle in sight
Fair Value:€7.0178.0% undervalued
8 followersusers have followed this narrative
0 commentsusers have commented on this narrative
0 likesusers have liked this narrative
MA


MarkoVT on COVER ·
Q3 Outlook modestly optimistic
Fair Value:JP¥1.65k2.0% overvalued
1 followerusers have followed this narrative
0 commentsusers have commented on this narrative
0 likesusers have liked this narrative
BL


BlackGoat on Alphabet ·
Alphabet: The Under-appreciated Compounder Hiding in Plain Sight
Fair Value:US$324.481.3% undervalued
80 followersusers have followed this narrative
3 commentsusers have commented on this narrative
1 likeusers have liked this narrative
Popular Narratives
OS

oscargarcia on Alphabet ·
The company that turned a verb into a global necessity and basically runs the modern internet, digital ads, smartphones, maps, and AI.
Fair Value:US$3405.9% undervalued
136 followersusers have followed this narrative
6 commentsusers have commented on this narrative
18 likesusers have liked this narrative
TH

TheWallstreetKing on MicroVision ·
MicroVision will explode future revenue by 380.37% with a vision towards success
Fair Value:US$6098.4% undervalued
91 followersusers have followed this narrative
10 commentsusers have commented on this narrative
18 likesusers have liked this narrative
AN


AnalystConsensusTarget on NVIDIA ·
NVDA: Expanding AI Demand Will Drive Major Data Center Investments Through 2026
Fair Value:US$232.7922.6% undervalued
928 followersusers have followed this narrative
6 commentsusers have commented on this narrative
22 likesusers have liked this narrative