- Hong Kong
- /
- Real Estate
- /
- SEHK:565
Art Group Holdings (HKG:565) three-year losses have grown faster than shareholder returns have fallen, but the stock spikes 31% this past week


It is a pleasure to report that the Art Group Holdings Limited (HKG:565) is up 41% in the last quarter. But that doesn't change the fact that the returns over the last three years have been less than pleasing. In fact, the share price is down 44% in the last three years, falling well short of the market return.
On a more encouraging note the company has added HK$140m to its market cap in just the last 7 days, so let's see if we can determine what's driven the three-year loss for shareholders.
View our latest analysis for Art Group Holdings
Because Art Group Holdings made a loss in the last twelve months, we think the market is probably more focussed on revenue and revenue growth, at least for now. When a company doesn't make profits, we'd generally hope to see good revenue growth. That's because it's hard to be confident a company will be sustainable if revenue growth is negligible, and it never makes a profit.
Over the last three years, Art Group Holdings' revenue dropped 8.7% per year. That's not what investors generally want to see. The stock has disappointed holders over the last three years, falling 13%, annualized. That makes sense given the lack of either profits or revenue growth. Of course, sentiment could become too negative, and the company may actually be making progress to profitability.
The company's revenue and earnings (over time) are depicted in the image below (click to see the exact numbers).
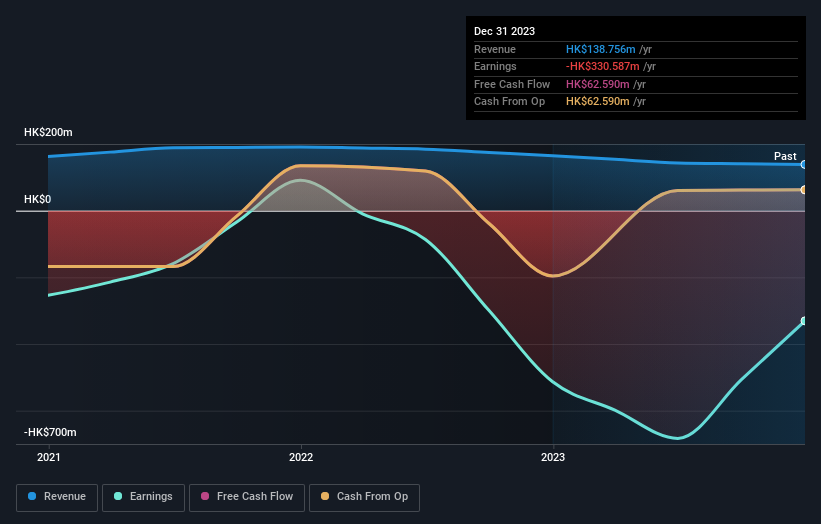
We consider it positive that insiders have made significant purchases in the last year. Having said that, most people consider earnings and revenue growth trends to be a more meaningful guide to the business. This free interactive report on Art Group Holdings' earnings, revenue and cash flow is a great place to start, if you want to investigate the stock further.
What About The Total Shareholder Return (TSR)?
Investors should note that there's a difference between Art Group Holdings' total shareholder return (TSR) and its share price change, which we've covered above. The TSR is a return calculation that accounts for the value of cash dividends (assuming that any dividend received was reinvested) and the calculated value of any discounted capital raisings and spin-offs. Art Group Holdings hasn't been paying dividends, but its TSR of -25% exceeds its share price return of -44%, implying it has either spun-off a business, or raised capital at a discount; thereby providing additional value to shareholders.
A Different Perspective
It's nice to see that Art Group Holdings shareholders have received a total shareholder return of 12% over the last year. Notably the five-year annualised TSR loss of 1.1% per year compares very unfavourably with the recent share price performance. We generally put more weight on the long term performance over the short term, but the recent improvement could hint at a (positive) inflection point within the business. I find it very interesting to look at share price over the long term as a proxy for business performance. But to truly gain insight, we need to consider other information, too. Case in point: We've spotted 4 warning signs for Art Group Holdings you should be aware of, and 2 of them make us uncomfortable.
Art Group Holdings is not the only stock insiders are buying. So take a peek at this free list of small cap companies at attractive valuations which insiders have been buying.
Please note, the market returns quoted in this article reflect the market weighted average returns of stocks that currently trade on Hong Kong exchanges.
New: Manage All Your Stock Portfolios in One Place
We've created the ultimate portfolio companion for stock investors, and it's free.
• Connect an unlimited number of Portfolios and see your total in one currency
• Be alerted to new Warning Signs or Risks via email or mobile
• Track the Fair Value of your stocks
Have feedback on this article? Concerned about the content? Get in touch with us directly. Alternatively, email editorial-team (at) simplywallst.com.
This article by Simply Wall St is general in nature. We provide commentary based on historical data and analyst forecasts only using an unbiased methodology and our articles are not intended to be financial advice. It does not constitute a recommendation to buy or sell any stock, and does not take account of your objectives, or your financial situation. We aim to bring you long-term focused analysis driven by fundamental data. Note that our analysis may not factor in the latest price-sensitive company announcements or qualitative material. Simply Wall St has no position in any stocks mentioned.
About SEHK:565
Art Group Holdings
An investment holding company, engages in the provision of rental, management, and operating services for tenants of shopping malls in the People’s Republic of China.
Adequate balance sheet very low.
