
Advertisement
- Hong Kong
- /
- Real Estate
- /
- SEHK:224
Estimating The Intrinsic Value Of Pioneer Global Group Limited (HKG:224)
Key Insights
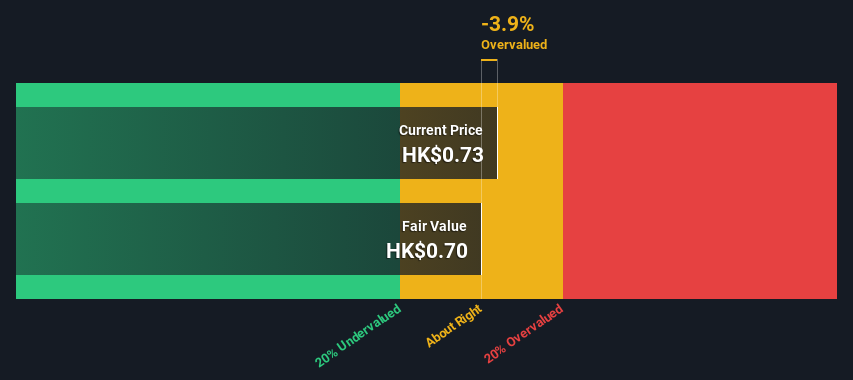
- The projected fair value for Pioneer Global Group is HK$0.70 based on 2 Stage Free Cash Flow to Equity
- With HK$0.73 share price, Pioneer Global Group appears to be trading close to its estimated fair value
In this article we are going to estimate the intrinsic value of Pioneer Global Group Limited (HKG:224) by taking the expected future cash flows and discounting them to today's value. Our analysis will employ the Discounted Cash Flow (DCF) model. Believe it or not, it's not too difficult to follow, as you'll see from our example!
Companies can be valued in a lot of ways, so we would point out that a DCF is not perfect for every situation. Anyone interested in learning a bit more about intrinsic value should have a read of the Simply Wall St analysis model.
View our latest analysis for Pioneer Global Group
Step By Step Through The Calculation
We're using the 2-stage growth model, which simply means we take in account two stages of company's growth. In the initial period the company may have a higher growth rate and the second stage is usually assumed to have a stable growth rate. To start off with, we need to estimate the next ten years of cash flows. Seeing as no analyst estimates of free cash flow are available to us, we have extrapolate the previous free cash flow (FCF) from the company's last reported value. We assume companies with shrinking free cash flow will slow their rate of shrinkage, and that companies with growing free cash flow will see their growth rate slow, over this period. We do this to reflect that growth tends to slow more in the early years than it does in later years.
Generally we assume that a dollar today is more valuable than a dollar in the future, and so the sum of these future cash flows is then discounted to today's value:
10-year free cash flow (FCF) estimate
| 2024 | 2025 | 2026 | 2027 | 2028 | 2029 | 2030 | 2031 | 2032 | 2033 | |
| Levered FCF (HK$, Millions) | HK$110.6m | HK$102.9m | HK$98.5m | HK$96.2m | HK$95.2m | HK$95.1m | HK$95.7m | HK$96.7m | HK$98.1m | HK$99.7m |
| Growth Rate Estimate Source | Est @ -10.96% | Est @ -7.03% | Est @ -4.28% | Est @ -2.35% | Est @ -1.00% | Est @ -0.05% | Est @ 0.61% | Est @ 1.07% | Est @ 1.39% | Est @ 1.62% |
| Present Value (HK$, Millions) Discounted @ 13% | HK$97.8 | HK$80.4 | HK$68.0 | HK$58.7 | HK$51.4 | HK$45.4 | HK$40.4 | HK$36.1 | HK$32.4 | HK$29.1 |
("Est" = FCF growth rate estimated by Simply Wall St)
Present Value of 10-year Cash Flow (PVCF) = HK$540m
After calculating the present value of future cash flows in the initial 10-year period, we need to calculate the Terminal Value, which accounts for all future cash flows beyond the first stage. For a number of reasons a very conservative growth rate is used that cannot exceed that of a country's GDP growth. In this case we have used the 5-year average of the 10-year government bond yield (2.2%) to estimate future growth. In the same way as with the 10-year 'growth' period, we discount future cash flows to today's value, using a cost of equity of 13%.
Terminal Value (TV)= FCF2033 × (1 + g) ÷ (r – g) = HK$100m× (1 + 2.2%) ÷ (13%– 2.2%) = HK$929m
Present Value of Terminal Value (PVTV)= TV / (1 + r)10= HK$929m÷ ( 1 + 13%)10= HK$271m
The total value, or equity value, is then the sum of the present value of the future cash flows, which in this case is HK$811m. The last step is to then divide the equity value by the number of shares outstanding. Compared to the current share price of HK$0.7, the company appears around fair value at the time of writing. Remember though, that this is just an approximate valuation, and like any complex formula - garbage in, garbage out.
The Assumptions
Now the most important inputs to a discounted cash flow are the discount rate, and of course, the actual cash flows. Part of investing is coming up with your own evaluation of a company's future performance, so try the calculation yourself and check your own assumptions. The DCF also does not consider the possible cyclicality of an industry, or a company's future capital requirements, so it does not give a full picture of a company's potential performance. Given that we are looking at Pioneer Global Group as potential shareholders, the cost of equity is used as the discount rate, rather than the cost of capital (or weighted average cost of capital, WACC) which accounts for debt. In this calculation we've used 13%, which is based on a levered beta of 2.000. Beta is a measure of a stock's volatility, compared to the market as a whole. We get our beta from the industry average beta of globally comparable companies, with an imposed limit between 0.8 and 2.0, which is a reasonable range for a stable business.
SWOT Analysis for Pioneer Global Group
Strength
- Earnings growth over the past year exceeded the industry.
- Net debt to equity ratio below 40%.
- Dividends are covered by earnings and cash flows.
Weakness
- Interest payments on debt are not well covered.
- Dividend is low compared to the top 25% of dividend payers in the Real Estate market.
- Current share price is above our estimate of fair value.
Opportunity
- 224's financial characteristics indicate limited near-term opportunities for shareholders.
- Lack of analyst coverage makes it difficult to determine 224's earnings prospects.
Threat
- Debt is not well covered by operating cash flow.
Moving On:
Whilst important, the DCF calculation ideally won't be the sole piece of analysis you scrutinize for a company. It's not possible to obtain a foolproof valuation with a DCF model. Instead the best use for a DCF model is to test certain assumptions and theories to see if they would lead to the company being undervalued or overvalued. For example, changes in the company's cost of equity or the risk free rate can significantly impact the valuation. For Pioneer Global Group, there are three further elements you should consider:
- Risks: For instance, we've identified 1 warning sign for Pioneer Global Group that you should be aware of.
- Other High Quality Alternatives: Do you like a good all-rounder? Explore our interactive list of high quality stocks to get an idea of what else is out there you may be missing!
- Other Environmentally-Friendly Companies: Concerned about the environment and think consumers will buy eco-friendly products more and more? Browse through our interactive list of companies that are thinking about a greener future to discover some stocks you may not have thought of!
PS. The Simply Wall St app conducts a discounted cash flow valuation for every stock on the SEHK every day. If you want to find the calculation for other stocks just search here.
New: Manage All Your Stock Portfolios in One Place
We've created the ultimate portfolio companion for stock investors, and it's free.
• Connect an unlimited number of Portfolios and see your total in one currency
• Be alerted to new Warning Signs or Risks via email or mobile
• Track the Fair Value of your stocks
Have feedback on this article? Concerned about the content? Get in touch with us directly. Alternatively, email editorial-team (at) simplywallst.com.
This article by Simply Wall St is general in nature. We provide commentary based on historical data and analyst forecasts only using an unbiased methodology and our articles are not intended to be financial advice. It does not constitute a recommendation to buy or sell any stock, and does not take account of your objectives, or your financial situation. We aim to bring you long-term focused analysis driven by fundamental data. Note that our analysis may not factor in the latest price-sensitive company announcements or qualitative material. Simply Wall St has no position in any stocks mentioned.
About SEHK:224
Pioneer Global Group
An investment holding company, engages in the real estate investment business in Hong Kong and internationally.
Mediocre balance sheet and slightly overvalued.
Market Insights

Advertisement
Community Narratives
MINISO's fair value is projected at 26.69 with an anticipated PE ratio shift of 20x
Fair Value US$24.03|11.0% undervalued
BE
Community Contributor
Procter & Gamble: A Dividend Giant Facing Slowing Growth
Fair Value US$119.81|23.3% overvalued
AN
Community Contributor
Eli Lilly's Future Growth Driven by Tirzepatide and Favorable Market Conditions
Fair Value US$1.19k|13.8% undervalued
EA
Community Contributor