- Hong Kong
- /
- Real Estate
- /
- SEHK:1168
Further weakness as Sinolink Worldwide Holdings (HKG:1168) drops 11% this week, taking five-year losses to 77%


Some stocks are best avoided. We really hate to see fellow investors lose their hard-earned money. Imagine if you held Sinolink Worldwide Holdings Limited (HKG:1168) for half a decade as the share price tanked 82%. And we doubt long term believers are the only worried holders, since the stock price has declined 39% over the last twelve months. The falls have accelerated recently, with the share price down 25% in the last three months. While a drop like that is definitely a body blow, money isn't as important as health and happiness.
If the past week is anything to go by, investor sentiment for Sinolink Worldwide Holdings isn't positive, so let's see if there's a mismatch between fundamentals and the share price.
Check out our latest analysis for Sinolink Worldwide Holdings
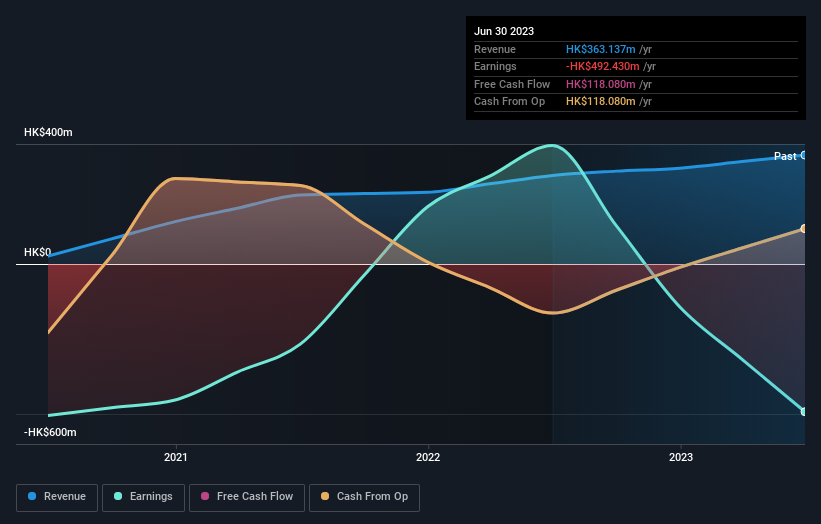
Sinolink Worldwide Holdings wasn't profitable in the last twelve months, it is unlikely we'll see a strong correlation between its share price and its earnings per share (EPS). Arguably revenue is our next best option. Shareholders of unprofitable companies usually expect strong revenue growth. Some companies are willing to postpone profitability to grow revenue faster, but in that case one does expect good top-line growth.
In the last five years Sinolink Worldwide Holdings saw its revenue shrink by 0.08% per year. While far from catastrophic that is not good. The share price fall of 13% (per year, over five years) is a stern reminder that money-losing companies are expected to grow revenue. We're generally averse to companies with declining revenues, but we're not alone in that. Fear of becoming a 'bagholder' may be keeping people away from this stock.
The image below shows how earnings and revenue have tracked over time (if you click on the image you can see greater detail).
If you are thinking of buying or selling Sinolink Worldwide Holdings stock, you should check out this FREE detailed report on its balance sheet.
What About The Total Shareholder Return (TSR)?
Investors should note that there's a difference between Sinolink Worldwide Holdings' total shareholder return (TSR) and its share price change, which we've covered above. Arguably the TSR is a more complete return calculation because it accounts for the value of dividends (as if they were reinvested), along with the hypothetical value of any discounted capital that have been offered to shareholders. Sinolink Worldwide Holdings hasn't been paying dividends, but its TSR of -77% exceeds its share price return of -82%, implying it has either spun-off a business, or raised capital at a discount; thereby providing additional value to shareholders.
A Different Perspective
Sinolink Worldwide Holdings shareholders are down 39% for the year, but the market itself is up 9.6%. However, keep in mind that even the best stocks will sometimes underperform the market over a twelve month period. Unfortunately, last year's performance may indicate unresolved challenges, given that it was worse than the annualised loss of 12% over the last half decade. Generally speaking long term share price weakness can be a bad sign, though contrarian investors might want to research the stock in hope of a turnaround. It's always interesting to track share price performance over the longer term. But to understand Sinolink Worldwide Holdings better, we need to consider many other factors. Take risks, for example - Sinolink Worldwide Holdings has 1 warning sign we think you should be aware of.
If you like to buy stocks alongside management, then you might just love this free list of companies. (Hint: insiders have been buying them).
Please note, the market returns quoted in this article reflect the market weighted average returns of stocks that currently trade on Hong Kong exchanges.
New: Manage All Your Stock Portfolios in One Place
We've created the ultimate portfolio companion for stock investors, and it's free.
• Connect an unlimited number of Portfolios and see your total in one currency
• Be alerted to new Warning Signs or Risks via email or mobile
• Track the Fair Value of your stocks
Have feedback on this article? Concerned about the content? Get in touch with us directly. Alternatively, email editorial-team (at) simplywallst.com.
This article by Simply Wall St is general in nature. We provide commentary based on historical data and analyst forecasts only using an unbiased methodology and our articles are not intended to be financial advice. It does not constitute a recommendation to buy or sell any stock, and does not take account of your objectives, or your financial situation. We aim to bring you long-term focused analysis driven by fundamental data. Note that our analysis may not factor in the latest price-sensitive company announcements or qualitative material. Simply Wall St has no position in any stocks mentioned.
About SEHK:1168
Sinolink Worldwide Holdings
An investment holding company, primarily engages in financial technology investment and management in the People’s Republic of China.
Adequate balance sheet and slightly overvalued.
