
Advertisement
Alphamab Oncology's (HKG:9966) Shares Climb 27% But Its Business Is Yet to Catch Up
Despite an already strong run, Alphamab Oncology (HKG:9966) shares have been powering on, with a gain of 27% in the last thirty days. Still, the 30-day jump doesn't change the fact that longer term shareholders have seen their stock decimated by the 66% share price drop in the last twelve months.
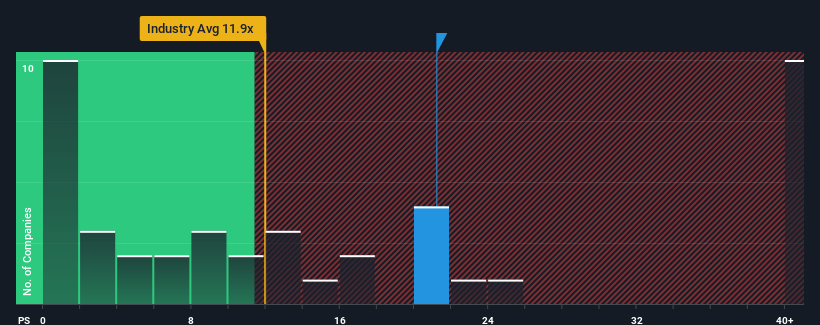
After such a large jump in price, Alphamab Oncology's price-to-sales (or "P/S") ratio of 21.2x might make it look like a strong sell right now compared to other companies in the Biotechs industry in Hong Kong, where around half of the companies have P/S ratios below 11.9x and even P/S below 2x are quite common. However, the P/S might be quite high for a reason and it requires further investigation to determine if it's justified.
Check out our latest analysis for Alphamab Oncology
How Has Alphamab Oncology Performed Recently?
Recent times haven't been great for Alphamab Oncology as its revenue has been rising slower than most other companies. It might be that many expect the uninspiring revenue performance to recover significantly, which has kept the P/S ratio from collapsing. You'd really hope so, otherwise you're paying a pretty hefty price for no particular reason.
Want the full picture on analyst estimates for the company? Then our free report on Alphamab Oncology will help you uncover what's on the horizon.What Are Revenue Growth Metrics Telling Us About The High P/S?
There's an inherent assumption that a company should far outperform the industry for P/S ratios like Alphamab Oncology's to be considered reasonable.
Taking a look back first, we see that the company grew revenue by an impressive 31% last year. Although, its longer-term performance hasn't been as strong with three-year revenue growth being relatively non-existent overall. So it appears to us that the company has had a mixed result in terms of growing revenue over that time.
Shifting to the future, estimates from the three analysts covering the company suggest revenue should grow by 38% each year over the next three years. That's shaping up to be materially lower than the 125% per year growth forecast for the broader industry.
With this information, we find it concerning that Alphamab Oncology is trading at a P/S higher than the industry. Apparently many investors in the company are way more bullish than analysts indicate and aren't willing to let go of their stock at any price. Only the boldest would assume these prices are sustainable as this level of revenue growth is likely to weigh heavily on the share price eventually.
The Key Takeaway
Alphamab Oncology's P/S has grown nicely over the last month thanks to a handy boost in the share price. It's argued the price-to-sales ratio is an inferior measure of value within certain industries, but it can be a powerful business sentiment indicator.
It comes as a surprise to see Alphamab Oncology trade at such a high P/S given the revenue forecasts look less than stellar. Right now we aren't comfortable with the high P/S as the predicted future revenues aren't likely to support such positive sentiment for long. At these price levels, investors should remain cautious, particularly if things don't improve.
It's always necessary to consider the ever-present spectre of investment risk. We've identified 1 warning sign with Alphamab Oncology, and understanding should be part of your investment process.
Of course, profitable companies with a history of great earnings growth are generally safer bets. So you may wish to see this free collection of other companies that have reasonable P/E ratios and have grown earnings strongly.
New: Manage All Your Stock Portfolios in One Place
We've created the ultimate portfolio companion for stock investors, and it's free.
• Connect an unlimited number of Portfolios and see your total in one currency
• Be alerted to new Warning Signs or Risks via email or mobile
• Track the Fair Value of your stocks
Have feedback on this article? Concerned about the content? Get in touch with us directly. Alternatively, email editorial-team (at) simplywallst.com.
This article by Simply Wall St is general in nature. We provide commentary based on historical data and analyst forecasts only using an unbiased methodology and our articles are not intended to be financial advice. It does not constitute a recommendation to buy or sell any stock, and does not take account of your objectives, or your financial situation. We aim to bring you long-term focused analysis driven by fundamental data. Note that our analysis may not factor in the latest price-sensitive company announcements or qualitative material. Simply Wall St has no position in any stocks mentioned.
About SEHK:9966
Alphamab Oncology
A biopharmaceutical company, engages in the research, development, manufacture, and commercialization of biotherapeutics for cancer treatment in the People’s Republic of China.
Excellent balance sheet with acceptable track record.
Market Insights

Advertisement
Community Narratives
The Next Phase of Energy Storage: How NeoVolta Is Tackling America’s Power Crunch
Fair Value US$7.50|35.1% undervalued
MA
Community Contributor
Why EnSilica is Worth Possibly 13x its Current Price
Fair Value UK£5.00|89.8% undervalued
DO
Community Contributor
M&A Activity, Industry Diversification & A Defense Contract Monopoly Will Push BWXT For Healthy Long-Term Growth
Fair Value US$220.00|15.2% undervalued
CL
Community Contributor
A case for Cassiar Gold Corp (TSXV: GLDC) to reach CAD$8-10 before 2030 (X30-37)
Fair Value CA$10.00|96.0% undervalued
AG
Community Contributor