Are Strong Financial Prospects The Force That Is Driving The Momentum In SciClone Pharmaceuticals (Holdings) Limited's HKG:6600) Stock?


SciClone Pharmaceuticals (Holdings) (HKG:6600) has had a great run on the share market with its stock up by a significant 24% over the last month. Given the company's impressive performance, we decided to study its financial indicators more closely as a company's financial health over the long-term usually dictates market outcomes. Particularly, we will be paying attention to SciClone Pharmaceuticals (Holdings)'s ROE today.
ROE or return on equity is a useful tool to assess how effectively a company can generate returns on the investment it received from its shareholders. Put another way, it reveals the company's success at turning shareholder investments into profits.
See our latest analysis for SciClone Pharmaceuticals (Holdings)
How Do You Calculate Return On Equity?
The formula for ROE is:
Return on Equity = Net Profit (from continuing operations) ÷ Shareholders' Equity
So, based on the above formula, the ROE for SciClone Pharmaceuticals (Holdings) is:
34% = CN¥953m ÷ CN¥2.8b (Based on the trailing twelve months to June 2023).
The 'return' is the income the business earned over the last year. One way to conceptualize this is that for each HK$1 of shareholders' capital it has, the company made HK$0.34 in profit.
What Is The Relationship Between ROE And Earnings Growth?
So far, we've learned that ROE is a measure of a company's profitability. We now need to evaluate how much profit the company reinvests or "retains" for future growth which then gives us an idea about the growth potential of the company. Assuming everything else remains unchanged, the higher the ROE and profit retention, the higher the growth rate of a company compared to companies that don't necessarily bear these characteristics.
A Side By Side comparison of SciClone Pharmaceuticals (Holdings)'s Earnings Growth And 34% ROE
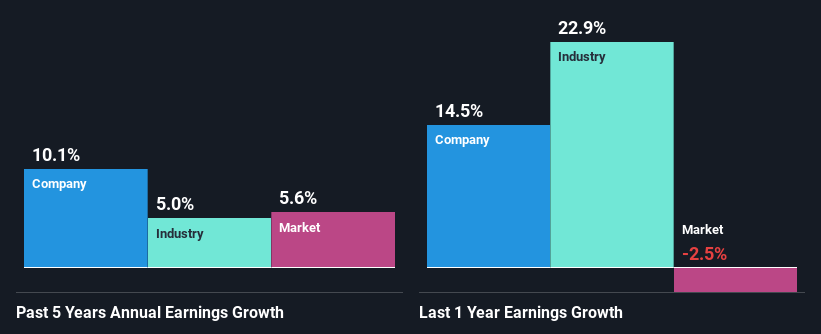
First thing first, we like that SciClone Pharmaceuticals (Holdings) has an impressive ROE. Secondly, even when compared to the industry average of 13% the company's ROE is quite impressive. This likely paved the way for the modest 10% net income growth seen by SciClone Pharmaceuticals (Holdings) over the past five years.
We then compared SciClone Pharmaceuticals (Holdings)'s net income growth with the industry and we're pleased to see that the company's growth figure is higher when compared with the industry which has a growth rate of 5.0% in the same 5-year period.
Earnings growth is a huge factor in stock valuation. The investor should try to establish if the expected growth or decline in earnings, whichever the case may be, is priced in. This then helps them determine if the stock is placed for a bright or bleak future. If you're wondering about SciClone Pharmaceuticals (Holdings)'s's valuation, check out this gauge of its price-to-earnings ratio, as compared to its industry.
Is SciClone Pharmaceuticals (Holdings) Efficiently Re-investing Its Profits?
SciClone Pharmaceuticals (Holdings) has a low three-year median payout ratio of 23%, meaning that the company retains the remaining 77% of its profits. This suggests that the management is reinvesting most of the profits to grow the business.
While SciClone Pharmaceuticals (Holdings) has seen growth in its earnings, it only recently started to pay a dividend. It is most likely that the company decided to impress new and existing shareholders with a dividend.
Conclusion
Overall, we are quite pleased with SciClone Pharmaceuticals (Holdings)'s performance. Particularly, we like that the company is reinvesting heavily into its business, and at a high rate of return. Unsurprisingly, this has led to an impressive earnings growth. On studying current analyst estimates, we found that analysts expect the company to continue its recent growth streak. To know more about the latest analysts predictions for the company, check out this visualization of analyst forecasts for the company.
New: Manage All Your Stock Portfolios in One Place
We've created the ultimate portfolio companion for stock investors, and it's free.
• Connect an unlimited number of Portfolios and see your total in one currency
• Be alerted to new Warning Signs or Risks via email or mobile
• Track the Fair Value of your stocks
Have feedback on this article? Concerned about the content? Get in touch with us directly. Alternatively, email editorial-team (at) simplywallst.com.
This article by Simply Wall St is general in nature. We provide commentary based on historical data and analyst forecasts only using an unbiased methodology and our articles are not intended to be financial advice. It does not constitute a recommendation to buy or sell any stock, and does not take account of your objectives, or your financial situation. We aim to bring you long-term focused analysis driven by fundamental data. Note that our analysis may not factor in the latest price-sensitive company announcements or qualitative material. Simply Wall St has no position in any stocks mentioned.
About SEHK:6600
SciClone Pharmaceuticals (Holdings)
A biopharmaceutical company, engages in the development and commercialization of pharmaceutical products in the therapeutic areas of oncology and severe infection in Mainland China and internationally.
Outstanding track record with flawless balance sheet.
