Advertisement
What Recent Partnership News Means for Shanghai Henlius Biotech’s Valuation in 2025

Simply Wall St
Reviewed by Simply Wall St
Deciding what to do with Shanghai Henlius Biotech stock these days? You are definitely not alone. The stock has been making waves and, depending on your lens, could be at an intriguing crossroads. If you are watching its recent movements, you might have caught last week’s dip of -11.8%. At first glance, that could spook even seasoned investors. But zoom out and you will notice a much bigger picture: despite the short-term stumble, Henlius has delivered an eye-popping 212.6% gain year to date and an even more impressive 219.3% rise over the past year. Going back three years, it is up 554.6%. That is serious momentum, and it is bound to pique your curiosity about what is driving these returns and what comes next.
Much of this action can be traced to shifting expectations in the biotech space. As the market weighs in on newer immunotherapy drugs and large-scale partnerships, Henlius has become a name investors are not ignoring. Still, even after such gains, the stock is not universally seen as expensive. In fact, based on widely used valuation checks, Henlius scores a 3 out of 6 on our undervaluation assessment, meaning it appears undervalued in half of the major metrics we track. That is not nothing, and it sets up a compelling case for a deeper dive.
So how do these valuation checks stack up, and are they telling the whole story? In the next section, we will break down the different methods analysts use to size up the company. And if you stick around till the end, you will get a look at a smarter, more holistic way to think about valuation altogether.
Shanghai Henlius Biotech delivered 219.3% returns over the last year. See how this stacks up to the rest of the Biotechs industry.Approach 1: Shanghai Henlius Biotech Discounted Cash Flow (DCF) Analysis
The Discounted Cash Flow (DCF) model is one of the most reliable methods analysts use to estimate a company’s value. It works by projecting the company’s future cash flows, essentially the actual cash the business generates each year, and then discounting those numbers to today’s value to reflect present-day worth. This approach helps investors understand what they might really be paying for, beyond just the current market sentiment.
For Shanghai Henlius Biotech, the most recent trailing twelve months’ Free Cash Flow stands at CN¥82.2 Million. From there, analysts expect growth to accelerate significantly, with forecasts predicting that by 2029, annual Free Cash Flow will climb to roughly CN¥2.1 Billion. These projections build the foundation for further estimates over the next decade. It is important to note that analyst coverage typically extends five years out, and later years involve extrapolation beyond direct forecasts.
According to this DCF assessment, the estimated intrinsic value per share comes out at HK$132.95. This value is 44.8% higher than the current market price, meaning the stock is considered substantially undervalued based on this model’s long-term cash flow assumptions. If you trust the growth trajectory built into these forecasts, there appears to be significant upside left in the tank.
Result: UNDERVALUED
Head to the Valuation section of our Company Report for more details on how we arrive at this Fair Value for Shanghai Henlius Biotech.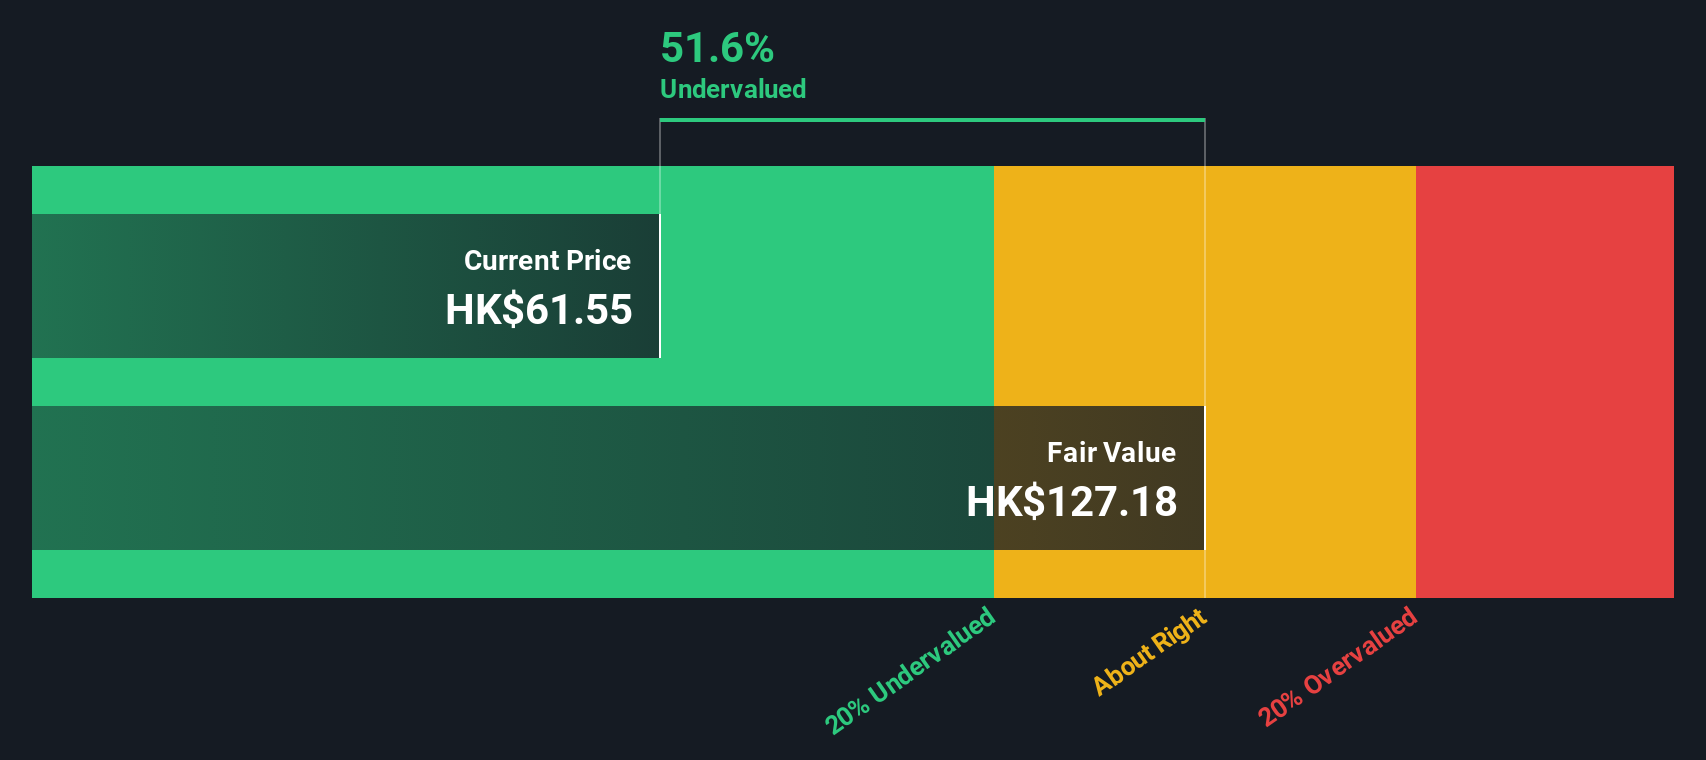
Approach 2: Shanghai Henlius Biotech Price vs Earnings (PE)
For companies like Shanghai Henlius Biotech that are solidly profitable, the Price-to-Earnings (PE) ratio is a widely accepted way to gauge valuation. The PE ratio is especially helpful for investors because it boils down all expectations about growth, risk, and profitability into a single, comparable number. When growth ambitions are high and risks seem contained, a higher PE can be justified. If the outlook is uncertain, a lower PE is usually warranted.
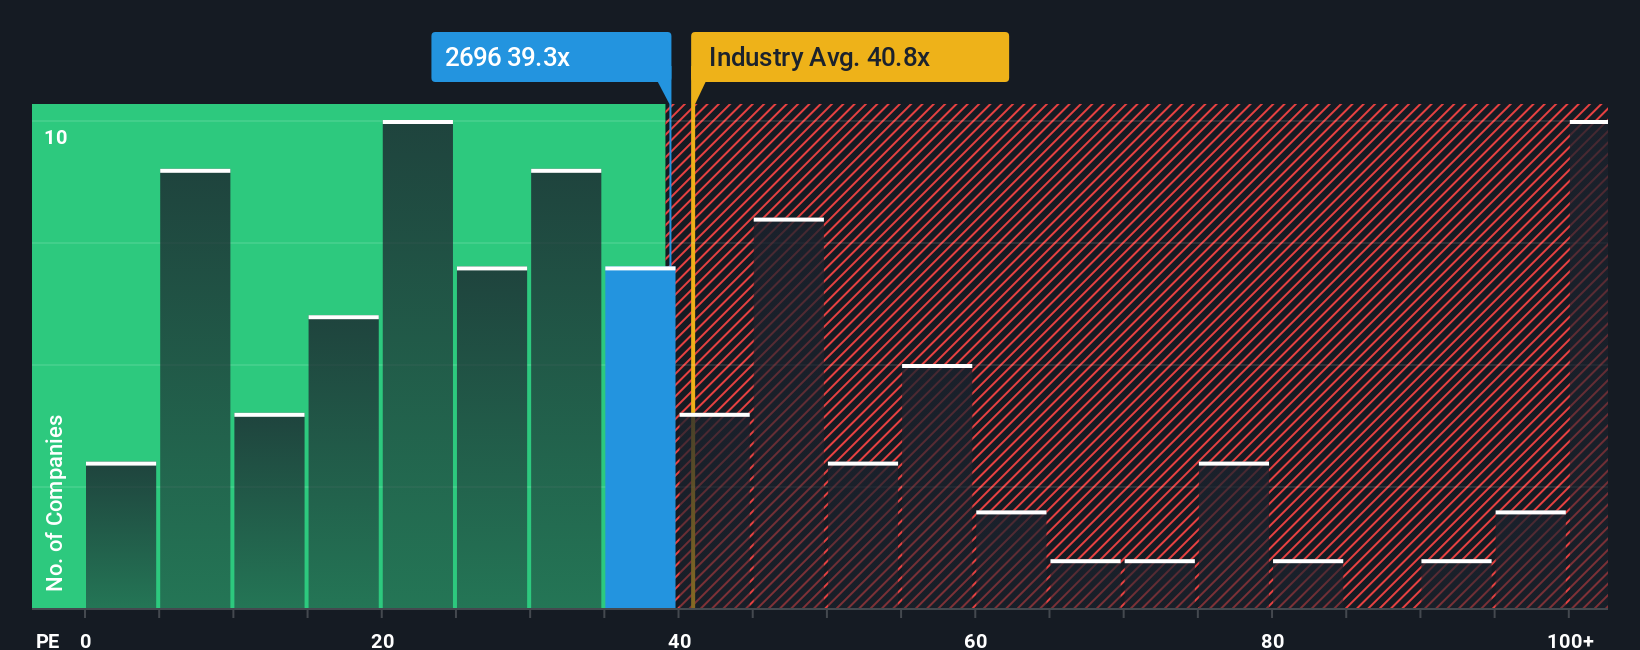
Shanghai Henlius Biotech currently trades at a PE ratio of 44.3x. To put that in context, this is above the industry average PE of 28.9x but notably below the average of its nearest biotech peers, which sits at 64.4x. These benchmarks are useful for a first glance, but they do not account for the company’s specific prospects or risk profile.
This is where Simply Wall St's proprietary “Fair Ratio” comes in. The Fair Ratio tells you what PE multiple the company really deserves, factoring in things like its earnings growth, financial health, industry conditions, profit margins, and market capitalization. For Shanghai Henlius Biotech, the Fair Ratio is set at 23.0x, indicating the multiple that best fits its unique fundamentals and future potential. Since the actual PE of 44.3x is nearly twice the Fair Ratio, the stock appears to be trading at a significant premium on this basis, which suggests caution may be warranted when buying at these levels.
Result: OVERVALUED
Upgrade Your Decision Making: Choose your Shanghai Henlius Biotech Narrative
Earlier, we mentioned there is an even better way to understand valuation, so let us introduce you to Narratives. A Narrative is simply your story or perspective about a company, combining what you believe about its future, such as fair value, revenue growth, or profit margins, with the numbers. Narratives bridge the gap between what is happening at Shanghai Henlius Biotech and your own forecasts. This makes it much easier to translate a company’s story into a financial outlook and fair value estimate.
This approach is both easy and accessible, available directly on Simply Wall St’s Community page, which millions of investors already use. Narratives clarify when it might be time to buy or sell by comparing your own fair value with the market price, and they update automatically as news or earnings reports roll in. For example, one investor might set a high fair value for Shanghai Henlius Biotech based on rapid global growth, while another could see a lower value if they believe competition will limit future gains. Narratives empower you to make decisions based on your personal convictions, all while staying grounded in transparent, up-to-date data.
Do you think there's more to the story for Shanghai Henlius Biotech? Create your own Narrative to let the Community know!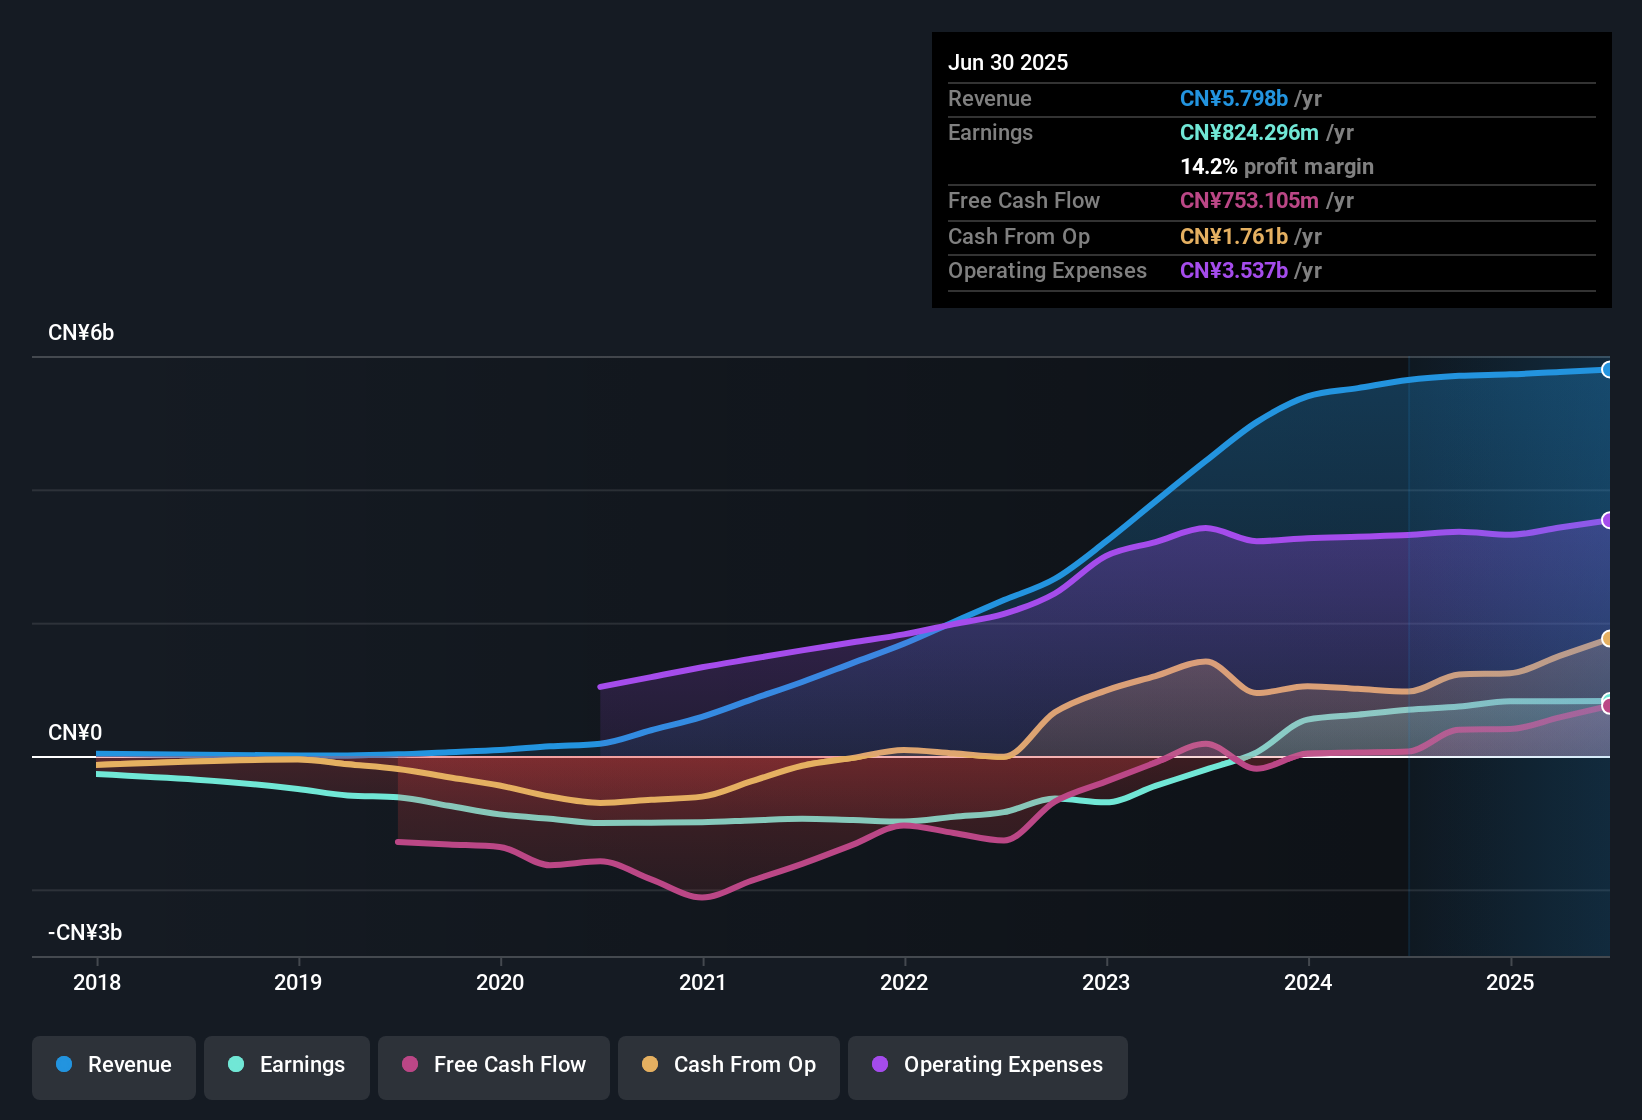
This article by Simply Wall St is general in nature. We provide commentary based on historical data and analyst forecasts only using an unbiased methodology and our articles are not intended to be financial advice. It does not constitute a recommendation to buy or sell any stock, and does not take account of your objectives, or your financial situation. We aim to bring you long-term focused analysis driven by fundamental data. Note that our analysis may not factor in the latest price-sensitive company announcements or qualitative material. Simply Wall St has no position in any stocks mentioned.
New: Manage All Your Stock Portfolios in One Place
We've created the ultimate portfolio companion for stock investors, and it's free.
• Connect an unlimited number of Portfolios and see your total in one currency
• Be alerted to new Warning Signs or Risks via email or mobile
• Track the Fair Value of your stocks
Have feedback on this article? Concerned about the content? Get in touch with us directly. Alternatively, email editorial-team@simplywallst.com
About SEHK:2696
Shanghai Henlius Biotech
Engages in the research and development of biologic medicines with a focus on oncology, autoimmune diseases, and ophthalmic diseases.
Proven track record and slightly overvalued.
Similar Companies
Market Insights

Advertisement
Community Narratives
MINISO's fair value is projected at 26.69 with an anticipated PE ratio shift of 20x
Fair Value US$24.03|11.0% undervalued
BE
Community Contributor
Procter & Gamble: A Dividend Giant Facing Slowing Growth
Fair Value US$119.81|23.3% overvalued
AN
Community Contributor
Eli Lilly's Future Growth Driven by Tirzepatide and Favorable Market Conditions
Fair Value US$1.19k|13.8% undervalued
EA
Community Contributor