As SSY Group (HKG:2005) rises 8.9% this past week, investors may now be noticing the company's five-year earnings growth


While it may not be enough for some shareholders, we think it is good to see the SSY Group Limited (HKG:2005) share price up 18% in a single quarter. But that doesn't change the fact that the returns over the last five years have been less than pleasing. After all, the share price is down 40% in that time, significantly under-performing the market.
The recent uptick of 8.9% could be a positive sign of things to come, so let's take a look at historical fundamentals.
Check out our latest analysis for SSY Group
While the efficient markets hypothesis continues to be taught by some, it has been proven that markets are over-reactive dynamic systems, and investors are not always rational. One imperfect but simple way to consider how the market perception of a company has shifted is to compare the change in the earnings per share (EPS) with the share price movement.
During the unfortunate half decade during which the share price slipped, SSY Group actually saw its earnings per share (EPS) improve by 7.3% per year. So it doesn't seem like EPS is a great guide to understanding how the market is valuing the stock. Or possibly, the market was previously very optimistic, so the stock has disappointed, despite improving EPS.
Due to the lack of correlation between the EPS growth and the falling share price, it's worth taking a look at other metrics to try to understand the share price movement.
Revenue is actually up 11% over the time period. So it seems one might have to take closer look at the fundamentals to understand why the share price languishes. After all, there may be an opportunity.
You can see below how earnings and revenue have changed over time (discover the exact values by clicking on the image).
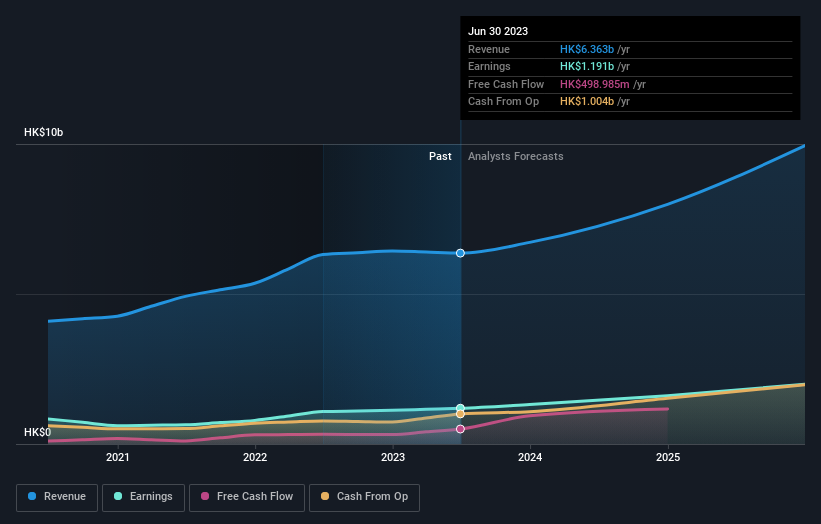
We consider it positive that insiders have made significant purchases in the last year. Even so, future earnings will be far more important to whether current shareholders make money. You can see what analysts are predicting for SSY Group in this interactive graph of future profit estimates.
What About Dividends?
When looking at investment returns, it is important to consider the difference between total shareholder return (TSR) and share price return. The TSR is a return calculation that accounts for the value of cash dividends (assuming that any dividend received was reinvested) and the calculated value of any discounted capital raisings and spin-offs. Arguably, the TSR gives a more comprehensive picture of the return generated by a stock. We note that for SSY Group the TSR over the last 5 years was -32%, which is better than the share price return mentioned above. This is largely a result of its dividend payments!
A Different Perspective
It's good to see that SSY Group has rewarded shareholders with a total shareholder return of 27% in the last twelve months. And that does include the dividend. There's no doubt those recent returns are much better than the TSR loss of 6% per year over five years. This makes us a little wary, but the business might have turned around its fortunes. I find it very interesting to look at share price over the long term as a proxy for business performance. But to truly gain insight, we need to consider other information, too. Even so, be aware that SSY Group is showing 1 warning sign in our investment analysis , you should know about...
SSY Group is not the only stock insiders are buying. So take a peek at this free list of growing companies with insider buying.
Please note, the market returns quoted in this article reflect the market weighted average returns of stocks that currently trade on Hong Kong exchanges.
New: Manage All Your Stock Portfolios in One Place
We've created the ultimate portfolio companion for stock investors, and it's free.
• Connect an unlimited number of Portfolios and see your total in one currency
• Be alerted to new Warning Signs or Risks via email or mobile
• Track the Fair Value of your stocks
Have feedback on this article? Concerned about the content? Get in touch with us directly. Alternatively, email editorial-team (at) simplywallst.com.
This article by Simply Wall St is general in nature. We provide commentary based on historical data and analyst forecasts only using an unbiased methodology and our articles are not intended to be financial advice. It does not constitute a recommendation to buy or sell any stock, and does not take account of your objectives, or your financial situation. We aim to bring you long-term focused analysis driven by fundamental data. Note that our analysis may not factor in the latest price-sensitive company announcements or qualitative material. Simply Wall St has no position in any stocks mentioned.
About SEHK:2005
SSY Group
An investment holding company, researches, develops, manufactures, trades in, and sells various pharmaceutical products to hospitals and distributors in the People’s Republic of China and internationally.
Undervalued with solid track record.
