
Advertisement
- Hong Kong
- /
- Entertainment
- /
- SEHK:8267
The Market Lifts Linekong Interactive Group Co., Ltd. (HKG:8267) Shares 54% But It Can Do More
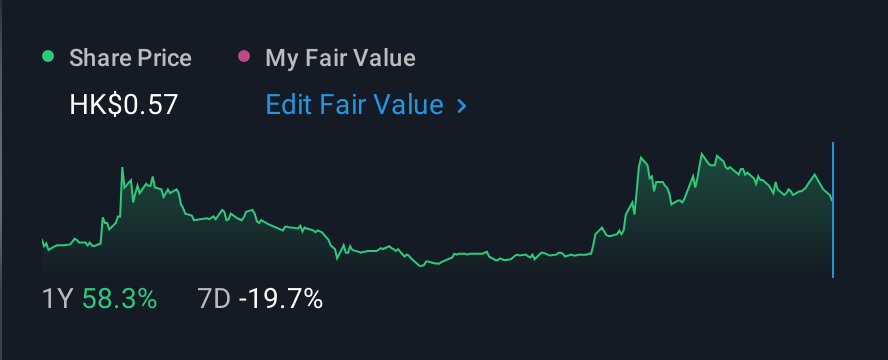
Linekong Interactive Group Co., Ltd. (HKG:8267) shares have continued their recent momentum with a 54% gain in the last month alone. The annual gain comes to 167% following the latest surge, making investors sit up and take notice.
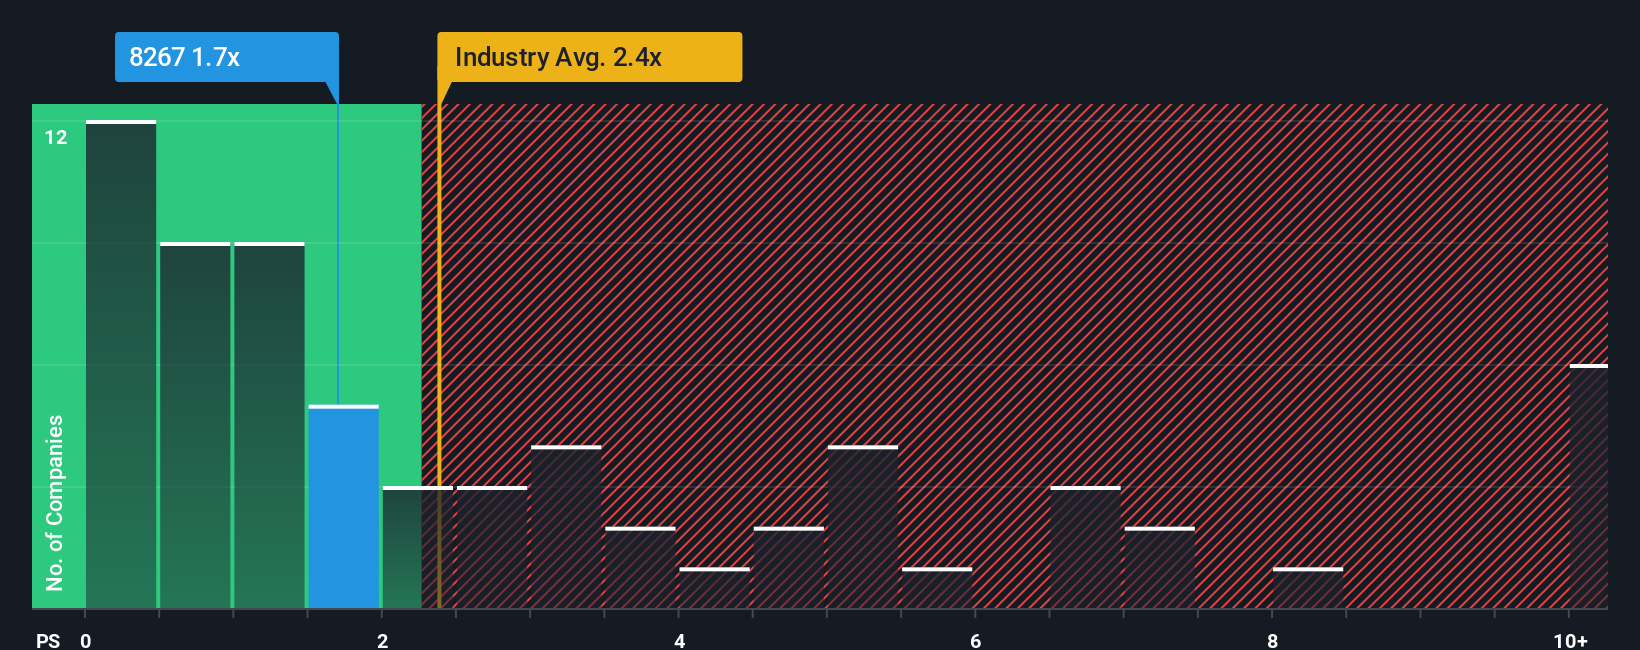
In spite of the firm bounce in price, Linekong Interactive Group may still be sending bullish signals at the moment with its price-to-sales (or "P/S") ratio of 1.7x, since almost half of all companies in the Entertainment industry in Hong Kong have P/S ratios greater than 2.4x and even P/S higher than 6x are not unusual. Although, it's not wise to just take the P/S at face value as there may be an explanation why it's limited.
Check out our latest analysis for Linekong Interactive Group
How Linekong Interactive Group Has Been Performing
Linekong Interactive Group has been doing a good job lately as it's been growing revenue at a solid pace. One possibility is that the P/S is low because investors think this respectable revenue growth might actually underperform the broader industry in the near future. If that doesn't eventuate, then existing shareholders have reason to be optimistic about the future direction of the share price.
We don't have analyst forecasts, but you can see how recent trends are setting up the company for the future by checking out our free report on Linekong Interactive Group's earnings, revenue and cash flow.Is There Any Revenue Growth Forecasted For Linekong Interactive Group?
There's an inherent assumption that a company should underperform the industry for P/S ratios like Linekong Interactive Group's to be considered reasonable.
Taking a look back first, we see that the company managed to grow revenues by a handy 7.8% last year. This was backed up an excellent period prior to see revenue up by 70% in total over the last three years. Therefore, it's fair to say the revenue growth recently has been superb for the company.
Comparing that recent medium-term revenue trajectory with the industry's one-year growth forecast of 12% shows it's noticeably more attractive.
With this information, we find it odd that Linekong Interactive Group is trading at a P/S lower than the industry. It looks like most investors are not convinced the company can maintain its recent growth rates.
The Key Takeaway
The latest share price surge wasn't enough to lift Linekong Interactive Group's P/S close to the industry median. It's argued the price-to-sales ratio is an inferior measure of value within certain industries, but it can be a powerful business sentiment indicator.
We're very surprised to see Linekong Interactive Group currently trading on a much lower than expected P/S since its recent three-year growth is higher than the wider industry forecast. Potential investors that are sceptical over continued revenue performance may be preventing the P/S ratio from matching previous strong performance. It appears many are indeed anticipating revenue instability, because the persistence of these recent medium-term conditions would normally provide a boost to the share price.
Before you settle on your opinion, we've discovered 2 warning signs for Linekong Interactive Group (1 is concerning!) that you should be aware of.
If you're unsure about the strength of Linekong Interactive Group's business, why not explore our interactive list of stocks with solid business fundamentals for some other companies you may have missed.
New: AI Stock Screener & Alerts
Our new AI Stock Screener scans the market every day to uncover opportunities.
• Dividend Powerhouses (3%+ Yield)
• Undervalued Small Caps with Insider Buying
• High growth Tech and AI Companies
Or build your own from over 50 metrics.
Have feedback on this article? Concerned about the content? Get in touch with us directly. Alternatively, email editorial-team (at) simplywallst.com.
This article by Simply Wall St is general in nature. We provide commentary based on historical data and analyst forecasts only using an unbiased methodology and our articles are not intended to be financial advice. It does not constitute a recommendation to buy or sell any stock, and does not take account of your objectives, or your financial situation. We aim to bring you long-term focused analysis driven by fundamental data. Note that our analysis may not factor in the latest price-sensitive company announcements or qualitative material. Simply Wall St has no position in any stocks mentioned.
About SEHK:8267
Linekong Interactive Group
An investment holding company, develops and publishes online games in the People’s Republic of China, South Korea, and internationally.
Excellent balance sheet and slightly overvalued.
Market Insights

Advertisement
Community Narratives
MicroVision will explode future revenue by 380.37% with a vision towards success
Fair Value US$60|98.4% undervalued
TH
Community Contributor
The Indispensable Artery for a New North American Economy
Fair Value CA$132.87|1.6% undervalued
TI
Community Contributor
Recently Updated Narratives
BE


Bejgal on MINISO Group Holding ·
MINISO's fair value is projected at 26.69 with an anticipated PE ratio shift of 20x
Fair Value:US$26.6928.0% undervalued
44 followersusers have followed this narrative
3 commentsusers have commented on this narrative
0 likesusers have liked this narrative
TI


TickerTickle on Oracle ·
The Quiet Giant That Became AI’s Power Grid
Fair Value:US$389.8149.5% undervalued
7 followersusers have followed this narrative
1 commentusers have commented on this narrative
0 likesusers have liked this narrative
AU

AuCA on Nova Ljubljanska Banka d.d ·
Nova Ljubljanska Banka d.d will expect a 11.2% revenue boost driving future growth
Fair Value:€20916.3% undervalued
23 followersusers have followed this narrative
3 commentsusers have commented on this narrative
0 likesusers have liked this narrative
Popular Narratives
OS


oscargarcia on Alphabet ·
The company that turned a verb into a global necessity and basically runs the modern internet, digital ads, smartphones, maps, and AI.
Fair Value:US$3404.9% undervalued
135 followersusers have followed this narrative
6 commentsusers have commented on this narrative
18 likesusers have liked this narrative
TH

TheWallstreetKing on MicroVision ·
MicroVision will explode future revenue by 380.37% with a vision towards success
Fair Value:US$6098.4% undervalued
86 followersusers have followed this narrative
11 commentsusers have commented on this narrative
18 likesusers have liked this narrative
AN


AnalystConsensusTarget on NVIDIA ·
NVDA: Expanding AI Demand Will Drive Major Data Center Investments Through 2026
Fair Value:US$232.7923.6% undervalued
923 followersusers have followed this narrative
5 commentsusers have commented on this narrative
22 likesusers have liked this narrative