Uju Holding Limited (HKG:1948) Stock's Been Sliding But Fundamentals Look Decent: Will The Market Correct The Share Price In The Future?


It is hard to get excited after looking at Uju Holding's (HKG:1948) recent performance, when its stock has declined 31% over the past three months. However, the company's fundamentals look pretty decent, and long-term financials are usually aligned with future market price movements. Particularly, we will be paying attention to Uju Holding's ROE today.
Return on equity or ROE is a key measure used to assess how efficiently a company's management is utilizing the company's capital. Simply put, it is used to assess the profitability of a company in relation to its equity capital.
View our latest analysis for Uju Holding
How Is ROE Calculated?
ROE can be calculated by using the formula:
Return on Equity = Net Profit (from continuing operations) ÷ Shareholders' Equity
So, based on the above formula, the ROE for Uju Holding is:
2.6% = CN¥36m ÷ CN¥1.3b (Based on the trailing twelve months to June 2023).
The 'return' is the yearly profit. That means that for every HK$1 worth of shareholders' equity, the company generated HK$0.03 in profit.
Why Is ROE Important For Earnings Growth?
Thus far, we have learned that ROE measures how efficiently a company is generating its profits. We now need to evaluate how much profit the company reinvests or "retains" for future growth which then gives us an idea about the growth potential of the company. Assuming all else is equal, companies that have both a higher return on equity and higher profit retention are usually the ones that have a higher growth rate when compared to companies that don't have the same features.
Uju Holding's Earnings Growth And 2.6% ROE
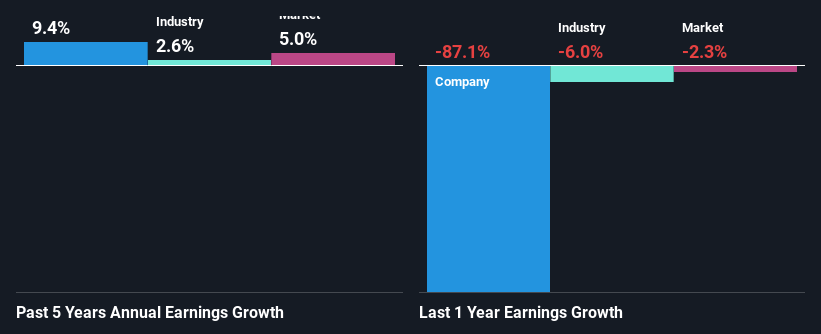
It is hard to argue that Uju Holding's ROE is much good in and of itself. Not just that, even compared to the industry average of 8.1%, the company's ROE is entirely unremarkable. Uju Holding was still able to see a decent net income growth of 9.4% over the past five years. We believe that there might be other aspects that are positively influencing the company's earnings growth. For instance, the company has a low payout ratio or is being managed efficiently.
As a next step, we compared Uju Holding's net income growth with the industry, and pleasingly, we found that the growth seen by the company is higher than the average industry growth of 2.6%.
Earnings growth is an important metric to consider when valuing a stock. It’s important for an investor to know whether the market has priced in the company's expected earnings growth (or decline). Doing so will help them establish if the stock's future looks promising or ominous. One good indicator of expected earnings growth is the P/E ratio which determines the price the market is willing to pay for a stock based on its earnings prospects. So, you may want to check if Uju Holding is trading on a high P/E or a low P/E, relative to its industry.
Is Uju Holding Making Efficient Use Of Its Profits?
Uju Holding's three-year median payout ratio to shareholders is 16% (implying that it retains 84% of its income), which is on the lower side, so it seems like the management is reinvesting profits heavily to grow its business.
Along with seeing a growth in earnings, Uju Holding only recently started paying dividends. Its quite possible that the company was looking to impress its shareholders.
Conclusion
In total, it does look like Uju Holding has some positive aspects to its business. Even in spite of the low rate of return, the company has posted impressive earnings growth as a result of reinvesting heavily into its business. While we won't completely dismiss the company, what we would do, is try to ascertain how risky the business is to make a more informed decision around the company. You can see the 1 risk we have identified for Uju Holding by visiting our risks dashboard for free on our platform here.
New: AI Stock Screener & Alerts
Our new AI Stock Screener scans the market every day to uncover opportunities.
• Dividend Powerhouses (3%+ Yield)
• Undervalued Small Caps with Insider Buying
• High growth Tech and AI Companies
Or build your own from over 50 metrics.
Have feedback on this article? Concerned about the content? Get in touch with us directly. Alternatively, email editorial-team (at) simplywallst.com.
This article by Simply Wall St is general in nature. We provide commentary based on historical data and analyst forecasts only using an unbiased methodology and our articles are not intended to be financial advice. It does not constitute a recommendation to buy or sell any stock, and does not take account of your objectives, or your financial situation. We aim to bring you long-term focused analysis driven by fundamental data. Note that our analysis may not factor in the latest price-sensitive company announcements or qualitative material. Simply Wall St has no position in any stocks mentioned.
About SEHK:1948
Uju Holding
Provides digital marketing services and live-streaming e-commerce in the People’s Republic of China.
Flawless balance sheet second-rate dividend payer.
