
Advertisement
- Hong Kong
- /
- Entertainment
- /
- SEHK:1022
Feiyu Technology International Company Ltd.'s (HKG:1022) Shares Climb 26% But Its Business Is Yet to Catch Up
Feiyu Technology International Company Ltd. (HKG:1022) shareholders would be excited to see that the share price has had a great month, posting a 26% gain and recovering from prior weakness. Not all shareholders will be feeling jubilant, since the share price is still down a very disappointing 33% in the last twelve months.
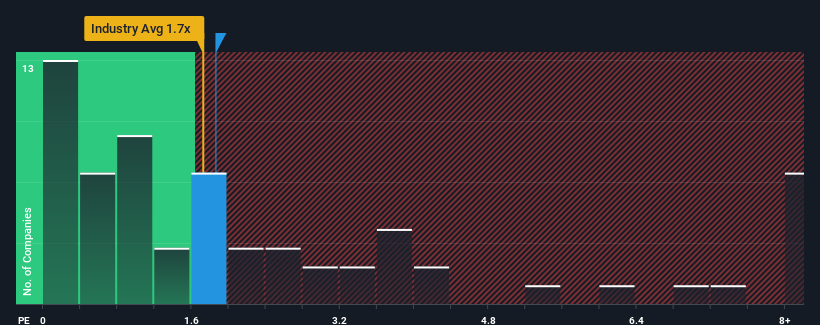
In spite of the firm bounce in price, you could still be forgiven for feeling indifferent about Feiyu Technology International's P/S ratio of 1.9x, since the median price-to-sales (or "P/S") ratio for the Entertainment industry in Hong Kong is also close to 1.7x. Although, it's not wise to simply ignore the P/S without explanation as investors may be disregarding a distinct opportunity or a costly mistake.
See our latest analysis for Feiyu Technology International
How Feiyu Technology International Has Been Performing
With revenue growth that's exceedingly strong of late, Feiyu Technology International has been doing very well. Perhaps the market is expecting future revenue performance to taper off, which has kept the P/S from rising. If that doesn't eventuate, then existing shareholders have reason to be feeling optimistic about the future direction of the share price.
Want the full picture on earnings, revenue and cash flow for the company? Then our free report on Feiyu Technology International will help you shine a light on its historical performance.Do Revenue Forecasts Match The P/S Ratio?
There's an inherent assumption that a company should be matching the industry for P/S ratios like Feiyu Technology International's to be considered reasonable.
Retrospectively, the last year delivered an exceptional 77% gain to the company's top line. Pleasingly, revenue has also lifted 90% in aggregate from three years ago, thanks to the last 12 months of growth. Therefore, it's fair to say the revenue growth recently has been superb for the company.
This is in contrast to the rest of the industry, which is expected to grow by 45% over the next year, materially higher than the company's recent medium-term annualised growth rates.
With this in mind, we find it intriguing that Feiyu Technology International's P/S is comparable to that of its industry peers. Apparently many investors in the company are less bearish than recent times would indicate and aren't willing to let go of their stock right now. They may be setting themselves up for future disappointment if the P/S falls to levels more in line with recent growth rates.
What Does Feiyu Technology International's P/S Mean For Investors?
Feiyu Technology International appears to be back in favour with a solid price jump bringing its P/S back in line with other companies in the industry Typically, we'd caution against reading too much into price-to-sales ratios when settling on investment decisions, though it can reveal plenty about what other market participants think about the company.
We've established that Feiyu Technology International's average P/S is a bit surprising since its recent three-year growth is lower than the wider industry forecast. When we see weak revenue with slower than industry growth, we suspect the share price is at risk of declining, bringing the P/S back in line with expectations. If recent medium-term revenue trends continue, the probability of a share price decline will become quite substantial, placing shareholders at risk.
Don't forget that there may be other risks. For instance, we've identified 2 warning signs for Feiyu Technology International that you should be aware of.
If strong companies turning a profit tickle your fancy, then you'll want to check out this free list of interesting companies that trade on a low P/E (but have proven they can grow earnings).
New: AI Stock Screener & Alerts
Our new AI Stock Screener scans the market every day to uncover opportunities.
• Dividend Powerhouses (3%+ Yield)
• Undervalued Small Caps with Insider Buying
• High growth Tech and AI Companies
Or build your own from over 50 metrics.
Have feedback on this article? Concerned about the content? Get in touch with us directly. Alternatively, email editorial-team (at) simplywallst.com.
This article by Simply Wall St is general in nature. We provide commentary based on historical data and analyst forecasts only using an unbiased methodology and our articles are not intended to be financial advice. It does not constitute a recommendation to buy or sell any stock, and does not take account of your objectives, or your financial situation. We aim to bring you long-term focused analysis driven by fundamental data. Note that our analysis may not factor in the latest price-sensitive company announcements or qualitative material. Simply Wall St has no position in any stocks mentioned.
About SEHK:1022
Feiyu Technology International
An investment holding company, engages in the development, operation, and distribution of various games in Mainland China.
Flawless balance sheet with proven track record.
Market Insights

Advertisement
Community Narratives
The company that turned a verb into a global necessity and basically runs the modern internet, digital ads, smartphones, maps, and AI.
Fair Value US$300.00|6.2% undervalued
OS
Community Contributor
Flowers Foods Pays A Fair Price For Health
Fair Value US$16.12|25.1% undervalued
NV
Community Contributor
TMX Group will thrive with 33.3% profit margin and enduring market moat
Fair Value CA$49.90|0.04% overvalued
LI
Community Contributor