
Advertisement
Market Still Lacking Some Conviction On Yunfeng Financial Group Limited (HKG:376)
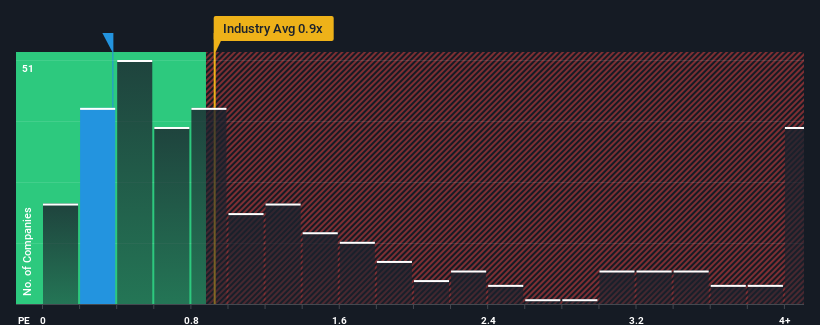
With a median price-to-sales (or "P/S") ratio of close to 0.4x in the Insurance industry in Hong Kong, you could be forgiven for feeling indifferent about Yunfeng Financial Group Limited's (HKG:376) P/S ratio, which comes in at about the same. However, investors might be overlooking a clear opportunity or potential setback if there is no rational basis for the P/S.
See our latest analysis for Yunfeng Financial Group
What Does Yunfeng Financial Group's P/S Mean For Shareholders?
With revenue growth that's exceedingly strong of late, Yunfeng Financial Group has been doing very well. The P/S is probably moderate because investors think this strong revenue growth might not be enough to outperform the broader industry in the near future. If you like the company, you'd be hoping this isn't the case so that you could potentially pick up some stock while it's not quite in favour.
Although there are no analyst estimates available for Yunfeng Financial Group, take a look at this free data-rich visualisation to see how the company stacks up on earnings, revenue and cash flow.What Are Revenue Growth Metrics Telling Us About The P/S?
The only time you'd be comfortable seeing a P/S like Yunfeng Financial Group's is when the company's growth is tracking the industry closely.
Taking a look back first, we see that the company grew revenue by an impressive 60% last year. The latest three year period has also seen a 25% overall rise in revenue, aided extensively by its short-term performance. So we can start by confirming that the company has actually done a good job of growing revenue over that time.
In contrast to the company, the rest of the industry is expected to decline by 21% over the next year, which puts the company's recent medium-term positive growth rates in a good light for now.
With this information, we find it odd that Yunfeng Financial Group is trading at a fairly similar P/S to the industry. Apparently some shareholders believe the recent performance is at its limits and have been accepting lower selling prices.
The Bottom Line On Yunfeng Financial Group's P/S
It's argued the price-to-sales ratio is an inferior measure of value within certain industries, but it can be a powerful business sentiment indicator.
As mentioned previously, Yunfeng Financial Group currently trades on a P/S on par with the wider industry, but this is lower than expected considering its recent three-year revenue growth is beating forecasts for a struggling industry. There could be some unobserved threats to revenue preventing the P/S ratio from outpacing the industry much like its revenue performance. Without the guidance of analysts, perhaps shareholders are feeling uncertain over whether the revenue performance can continue amidst a declining industry outlook. The fact that the company's relative performance has not provided a kick to the share price suggests that some investors are anticipating revenue instability.
Many other vital risk factors can be found on the company's balance sheet. You can assess many of the main risks through our free balance sheet analysis for Yunfeng Financial Group with six simple checks.
If strong companies turning a profit tickle your fancy, then you'll want to check out this free list of interesting companies that trade on a low P/E (but have proven they can grow earnings).
New: Manage All Your Stock Portfolios in One Place
We've created the ultimate portfolio companion for stock investors, and it's free.
• Connect an unlimited number of Portfolios and see your total in one currency
• Be alerted to new Warning Signs or Risks via email or mobile
• Track the Fair Value of your stocks
Have feedback on this article? Concerned about the content? Get in touch with us directly. Alternatively, email editorial-team (at) simplywallst.com.
This article by Simply Wall St is general in nature. We provide commentary based on historical data and analyst forecasts only using an unbiased methodology and our articles are not intended to be financial advice. It does not constitute a recommendation to buy or sell any stock, and does not take account of your objectives, or your financial situation. We aim to bring you long-term focused analysis driven by fundamental data. Note that our analysis may not factor in the latest price-sensitive company announcements or qualitative material. Simply Wall St has no position in any stocks mentioned.
About SEHK:376
Yunfeng Financial Group
An investment holding company, provides insurance products in Hong Kong and Macao.
Excellent balance sheet with proven track record.
Market Insights

Advertisement
Weekly Picks
FA

FAI on Arabian Internet and Communication Services ·
Solutions by stc: 34% Upside in Saudi's Digital Transformation Leader
Fair Value:ر.س342.2335.3% undervalued
9 followersusers have followed this narrative
1 commentusers have commented on this narrative
3 likesusers have liked this narrative
RO


RobertoAllende on NVIDIA ·
The AI Infrastructure Giant Grows Into Its Valuation
Fair Value:US$345.0747.9% undervalued
27 followersusers have followed this narrative
28 commentsusers have commented on this narrative
21 likesusers have liked this narrative
Recently Updated Narratives
TA


Talos on PayPal Holdings ·
The "Sleeping Giant" Wakes Up – Efficiency & Monetization
Fair Value:US$174.9264.2% undervalued
1 followerusers have followed this narrative
0 commentsusers have commented on this narrative
0 likesusers have liked this narrative
TA

Talos on Pagaya Technologies ·
The "Rate Cut" Supercycle Winner – Profitable & Accelerating
Fair Value:US$170.685.9% undervalued
1 followerusers have followed this narrative
0 commentsusers have commented on this narrative
0 likesusers have liked this narrative
TA

Talos on Archer Aviation ·
The Industrialist of the Skies – Scaling with "Automotive DNA
Fair Value:US$16.3254.3% undervalued
1 followerusers have followed this narrative
0 commentsusers have commented on this narrative
0 likesusers have liked this narrative
Popular Narratives
TH


TheWallstreetKing on MicroVision ·
MicroVision will explode future revenue by 380.37% with a vision towards success
Fair Value:US$6098.6% undervalued
110 followersusers have followed this narrative
11 commentsusers have commented on this narrative
22 likesusers have liked this narrative
AN

AnalystConsensusTarget on NVIDIA ·
NVDA: Expanding AI Demand Will Drive Major Data Center Investments Through 2026
Fair Value:US$250.3928.1% undervalued
943 followersusers have followed this narrative
6 commentsusers have commented on this narrative
24 likesusers have liked this narrative
OS


oscargarcia on Alphabet ·
The company that turned a verb into a global necessity and basically runs the modern internet, digital ads, smartphones, maps, and AI.
Fair Value:US$3407.4% undervalued
145 followersusers have followed this narrative
6 commentsusers have commented on this narrative
18 likesusers have liked this narrative