
Advertisement
- Hong Kong
- /
- Personal Products
- /
- SEHK:8436
Takbo Group Holdings Limited's (HKG:8436) Shares Climb 27% But Its Business Is Yet to Catch Up
Takbo Group Holdings Limited (HKG:8436) shareholders have had their patience rewarded with a 27% share price jump in the last month. Taking a wider view, although not as strong as the last month, the full year gain of 11% is also fairly reasonable.
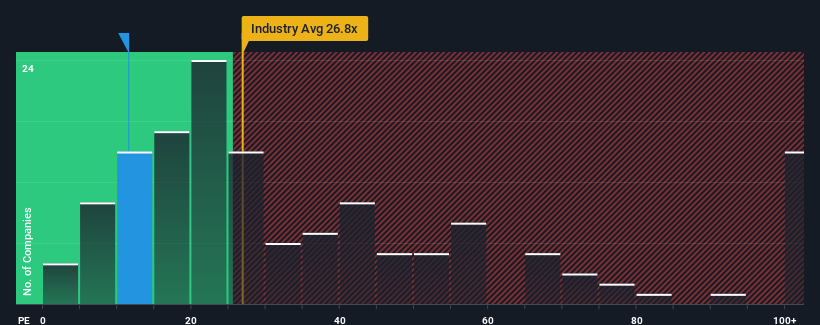
Following the firm bounce in price, Takbo Group Holdings' price-to-earnings (or "P/E") ratio of 11.5x might make it look like a sell right now compared to the market in Hong Kong, where around half of the companies have P/E ratios below 9x and even P/E's below 5x are quite common. However, the P/E might be high for a reason and it requires further investigation to determine if it's justified.
For instance, Takbo Group Holdings' receding earnings in recent times would have to be some food for thought. One possibility is that the P/E is high because investors think the company will still do enough to outperform the broader market in the near future. You'd really hope so, otherwise you're paying a pretty hefty price for no particular reason.
View our latest analysis for Takbo Group Holdings
How Is Takbo Group Holdings' Growth Trending?
Takbo Group Holdings' P/E ratio would be typical for a company that's expected to deliver solid growth, and importantly, perform better than the market.
If we review the last year of earnings, dishearteningly the company's profits fell to the tune of 26%. This means it has also seen a slide in earnings over the longer-term as EPS is down 64% in total over the last three years. So unfortunately, we have to acknowledge that the company has not done a great job of growing earnings over that time.
Weighing that medium-term earnings trajectory against the broader market's one-year forecast for expansion of 23% shows it's an unpleasant look.
In light of this, it's alarming that Takbo Group Holdings' P/E sits above the majority of other companies. Apparently many investors in the company are way more bullish than recent times would indicate and aren't willing to let go of their stock at any price. Only the boldest would assume these prices are sustainable as a continuation of recent earnings trends is likely to weigh heavily on the share price eventually.
The Key Takeaway
Takbo Group Holdings shares have received a push in the right direction, but its P/E is elevated too. Generally, our preference is to limit the use of the price-to-earnings ratio to establishing what the market thinks about the overall health of a company.
We've established that Takbo Group Holdings currently trades on a much higher than expected P/E since its recent earnings have been in decline over the medium-term. Right now we are increasingly uncomfortable with the high P/E as this earnings performance is highly unlikely to support such positive sentiment for long. Unless the recent medium-term conditions improve markedly, it's very challenging to accept these prices as being reasonable.
We don't want to rain on the parade too much, but we did also find 3 warning signs for Takbo Group Holdings (1 can't be ignored!) that you need to be mindful of.
If you're unsure about the strength of Takbo Group Holdings' business, why not explore our interactive list of stocks with solid business fundamentals for some other companies you may have missed.
Valuation is complex, but we're here to simplify it.
Discover if Takbo Group Holdings might be undervalued or overvalued with our detailed analysis, featuring fair value estimates, potential risks, dividends, insider trades, and its financial condition.
Access Free AnalysisHave feedback on this article? Concerned about the content? Get in touch with us directly. Alternatively, email editorial-team (at) simplywallst.com.
This article by Simply Wall St is general in nature. We provide commentary based on historical data and analyst forecasts only using an unbiased methodology and our articles are not intended to be financial advice. It does not constitute a recommendation to buy or sell any stock, and does not take account of your objectives, or your financial situation. We aim to bring you long-term focused analysis driven by fundamental data. Note that our analysis may not factor in the latest price-sensitive company announcements or qualitative material. Simply Wall St has no position in any stocks mentioned.
About SEHK:8436
Takbo Group Holdings
An investment holding company, designs, develops, manufactures, and sells beauty products in the United States, People’s Republic of China, Mexico, Belgium, Canada, the United Kingdom, Ireland, Hong Kong, and internationally.
Flawless balance sheet with slight risk.
Market Insights

Advertisement
Community Narratives
MicroVision will explode future revenue by 380.37% with a vision towards success
Fair Value US$60.00|98.3% undervalued
TH
Community Contributor
The Indispensable Artery for a New North American Economy
Fair Value CA$132.87|1.0% undervalued
TI
Community Contributor