
Advertisement
- Hong Kong
- /
- Household Products
- /
- SEHK:6601
Cheerwin Group Limited's (HKG:6601) Intrinsic Value Is Potentially 100% Above Its Share Price
Key Insights
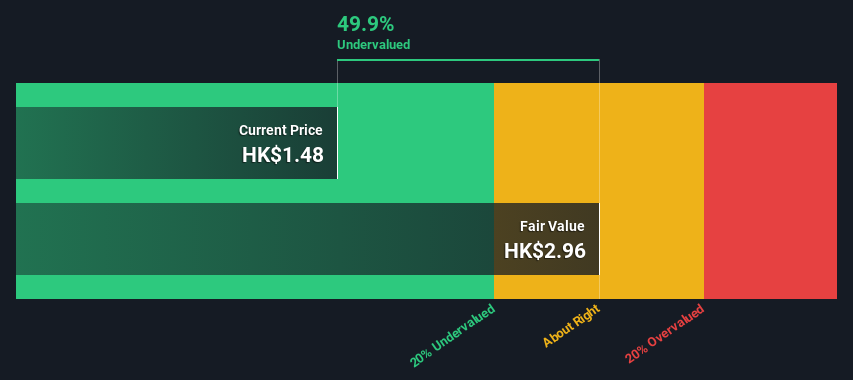
- Using the 2 Stage Free Cash Flow to Equity, Cheerwin Group fair value estimate is HK$2.96
- Cheerwin Group is estimated to be 50% undervalued based on current share price of HK$1.48
- Our fair value estimate is 27% higher than Cheerwin Group's analyst price target of CN¥2.33
Today we will run through one way of estimating the intrinsic value of Cheerwin Group Limited (HKG:6601) by taking the expected future cash flows and discounting them to their present value. This will be done using the Discounted Cash Flow (DCF) model. Before you think you won't be able to understand it, just read on! It's actually much less complex than you'd imagine.
We generally believe that a company's value is the present value of all of the cash it will generate in the future. However, a DCF is just one valuation metric among many, and it is not without flaws. For those who are keen learners of equity analysis, the Simply Wall St analysis model here may be something of interest to you.
View our latest analysis for Cheerwin Group
Crunching The Numbers
We use what is known as a 2-stage model, which simply means we have two different periods of growth rates for the company's cash flows. Generally the first stage is higher growth, and the second stage is a lower growth phase. In the first stage we need to estimate the cash flows to the business over the next ten years. Where possible we use analyst estimates, but when these aren't available we extrapolate the previous free cash flow (FCF) from the last estimate or reported value. We assume companies with shrinking free cash flow will slow their rate of shrinkage, and that companies with growing free cash flow will see their growth rate slow, over this period. We do this to reflect that growth tends to slow more in the early years than it does in later years.
Generally we assume that a dollar today is more valuable than a dollar in the future, so we need to discount the sum of these future cash flows to arrive at a present value estimate:
10-year free cash flow (FCF) estimate
| 2024 | 2025 | 2026 | 2027 | 2028 | 2029 | 2030 | 2031 | 2032 | 2033 | |
| Levered FCF (CN¥, Millions) | CN¥145.0m | CN¥164.0m | CN¥172.5m | CN¥179.8m | CN¥186.2m | CN¥191.9m | CN¥197.2m | CN¥202.1m | CN¥206.9m | CN¥211.5m |
| Growth Rate Estimate Source | Analyst x1 | Analyst x1 | Est @ 5.19% | Est @ 4.23% | Est @ 3.55% | Est @ 3.08% | Est @ 2.74% | Est @ 2.51% | Est @ 2.35% | Est @ 2.24% |
| Present Value (CN¥, Millions) Discounted @ 6.8% | CN¥136 | CN¥144 | CN¥142 | CN¥138 | CN¥134 | CN¥129 | CN¥124 | CN¥119 | CN¥114 | CN¥109 |
("Est" = FCF growth rate estimated by Simply Wall St)
Present Value of 10-year Cash Flow (PVCF) = CN¥1.3b
We now need to calculate the Terminal Value, which accounts for all the future cash flows after this ten year period. The Gordon Growth formula is used to calculate Terminal Value at a future annual growth rate equal to the 5-year average of the 10-year government bond yield of 2.0%. We discount the terminal cash flows to today's value at a cost of equity of 6.8%.
Terminal Value (TV)= FCF2033 × (1 + g) ÷ (r – g) = CN¥211m× (1 + 2.0%) ÷ (6.8%– 2.0%) = CN¥4.4b
Present Value of Terminal Value (PVTV)= TV / (1 + r)10= CN¥4.4b÷ ( 1 + 6.8%)10= CN¥2.3b
The total value, or equity value, is then the sum of the present value of the future cash flows, which in this case is CN¥3.6b. To get the intrinsic value per share, we divide this by the total number of shares outstanding. Relative to the current share price of HK$1.5, the company appears quite undervalued at a 50% discount to where the stock price trades currently. The assumptions in any calculation have a big impact on the valuation, so it is better to view this as a rough estimate, not precise down to the last cent.
The Assumptions
Now the most important inputs to a discounted cash flow are the discount rate, and of course, the actual cash flows. If you don't agree with these result, have a go at the calculation yourself and play with the assumptions. The DCF also does not consider the possible cyclicality of an industry, or a company's future capital requirements, so it does not give a full picture of a company's potential performance. Given that we are looking at Cheerwin Group as potential shareholders, the cost of equity is used as the discount rate, rather than the cost of capital (or weighted average cost of capital, WACC) which accounts for debt. In this calculation we've used 6.8%, which is based on a levered beta of 0.800. Beta is a measure of a stock's volatility, compared to the market as a whole. We get our beta from the industry average beta of globally comparable companies, with an imposed limit between 0.8 and 2.0, which is a reasonable range for a stable business.
SWOT Analysis for Cheerwin Group
Strength
- Earnings growth over the past year exceeded the industry.
- Currently debt free.
- Dividends are covered by earnings and cash flows.
Weakness
- Dividend is low compared to the top 25% of dividend payers in the Household Products market.
Opportunity
- Annual earnings are forecast to grow faster than the Hong Kong market.
- Trading below our estimate of fair value by more than 20%.
Threat
- Revenue is forecast to grow slower than 20% per year.
Moving On:
Although the valuation of a company is important, it shouldn't be the only metric you look at when researching a company. DCF models are not the be-all and end-all of investment valuation. Preferably you'd apply different cases and assumptions and see how they would impact the company's valuation. For example, changes in the company's cost of equity or the risk free rate can significantly impact the valuation. What is the reason for the share price sitting below the intrinsic value? For Cheerwin Group, there are three additional aspects you should explore:
- Risks: For example, we've discovered 1 warning sign for Cheerwin Group that you should be aware of before investing here.
- Future Earnings: How does 6601's growth rate compare to its peers and the wider market? Dig deeper into the analyst consensus number for the upcoming years by interacting with our free analyst growth expectation chart.
- Other High Quality Alternatives: Do you like a good all-rounder? Explore our interactive list of high quality stocks to get an idea of what else is out there you may be missing!
PS. The Simply Wall St app conducts a discounted cash flow valuation for every stock on the SEHK every day. If you want to find the calculation for other stocks just search here.
New: AI Stock Screener & Alerts
Our new AI Stock Screener scans the market every day to uncover opportunities.
• Dividend Powerhouses (3%+ Yield)
• Undervalued Small Caps with Insider Buying
• High growth Tech and AI Companies
Or build your own from over 50 metrics.
Have feedback on this article? Concerned about the content? Get in touch with us directly. Alternatively, email editorial-team (at) simplywallst.com.
This article by Simply Wall St is general in nature. We provide commentary based on historical data and analyst forecasts only using an unbiased methodology and our articles are not intended to be financial advice. It does not constitute a recommendation to buy or sell any stock, and does not take account of your objectives, or your financial situation. We aim to bring you long-term focused analysis driven by fundamental data. Note that our analysis may not factor in the latest price-sensitive company announcements or qualitative material. Simply Wall St has no position in any stocks mentioned.
About SEHK:6601
Cheerwin Group
An investment holding company, manufactures and trades household insecticides and repellents, household cleaning, air care, personal care, pet stores and pet products, and other products in the People’s Republic of China.
Very undervalued with flawless balance sheet.
Market Insights

Advertisement
Community Narratives
MicroVision will explode future revenue by 380.37% with a vision towards success
Fair Value US$60.00|98.4% undervalued
TH
Community Contributor
The Indispensable Artery for a New North American Economy
Fair Value CA$132.87|1.3% undervalued
TI
Community Contributor