- Hong Kong
- /
- Healthcare Services
- /
- SEHK:2289
The total return for Charmacy Pharmaceutical (HKG:2289) investors has risen faster than earnings growth over the last three years


Charmacy Pharmaceutical Co., Ltd. (HKG:2289) shareholders might be concerned after seeing the share price drop 24% in the last quarter. But that doesn't change the fact that the returns over the last three years have been very strong. Indeed, the share price is up a very strong 120% in that time. It's not uncommon to see a share price retrace a bit, after a big gain. If the business can perform well for years to come, then the recent drop could be an opportunity.
Although Charmacy Pharmaceutical has shed HK$185m from its market cap this week, let's take a look at its longer term fundamental trends and see if they've driven returns.
View our latest analysis for Charmacy Pharmaceutical
To quote Buffett, 'Ships will sail around the world but the Flat Earth Society will flourish. There will continue to be wide discrepancies between price and value in the marketplace...' One flawed but reasonable way to assess how sentiment around a company has changed is to compare the earnings per share (EPS) with the share price.
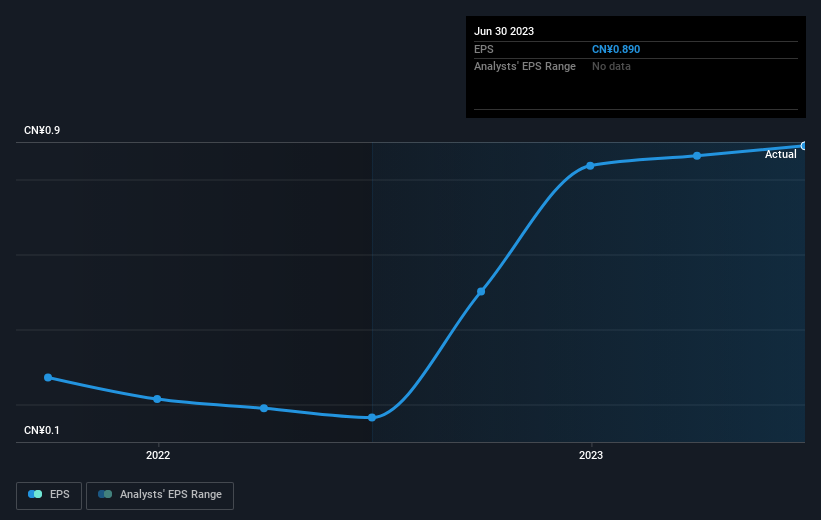
Charmacy Pharmaceutical was able to grow its EPS at 50% per year over three years, sending the share price higher. This EPS growth is higher than the 30% average annual increase in the share price. So one could reasonably conclude that the market has cooled on the stock. This cautious sentiment is reflected in its (fairly low) P/E ratio of 10.01.
You can see how EPS has changed over time in the image below (click on the chart to see the exact values).
It's probably worth noting that the CEO is paid less than the median at similar sized companies. It's always worth keeping an eye on CEO pay, but a more important question is whether the company will grow earnings throughout the years. Before buying or selling a stock, we always recommend a close examination of historic growth trends, available here..
What About Dividends?
As well as measuring the share price return, investors should also consider the total shareholder return (TSR). The TSR incorporates the value of any spin-offs or discounted capital raisings, along with any dividends, based on the assumption that the dividends are reinvested. Arguably, the TSR gives a more comprehensive picture of the return generated by a stock. We note that for Charmacy Pharmaceutical the TSR over the last 3 years was 144%, which is better than the share price return mentioned above. This is largely a result of its dividend payments!
A Different Perspective
It's good to see that Charmacy Pharmaceutical has rewarded shareholders with a total shareholder return of 45% in the last twelve months. Of course, that includes the dividend. That gain is better than the annual TSR over five years, which is 8%. Therefore it seems like sentiment around the company has been positive lately. In the best case scenario, this may hint at some real business momentum, implying that now could be a great time to delve deeper. While it is well worth considering the different impacts that market conditions can have on the share price, there are other factors that are even more important. Even so, be aware that Charmacy Pharmaceutical is showing 2 warning signs in our investment analysis , and 1 of those is concerning...
Of course, you might find a fantastic investment by looking elsewhere. So take a peek at this free list of companies we expect will grow earnings.
Please note, the market returns quoted in this article reflect the market weighted average returns of stocks that currently trade on Hong Kong exchanges.
New: AI Stock Screener & Alerts
Our new AI Stock Screener scans the market every day to uncover opportunities.
• Dividend Powerhouses (3%+ Yield)
• Undervalued Small Caps with Insider Buying
• High growth Tech and AI Companies
Or build your own from over 50 metrics.
Have feedback on this article? Concerned about the content? Get in touch with us directly. Alternatively, email editorial-team (at) simplywallst.com.
This article by Simply Wall St is general in nature. We provide commentary based on historical data and analyst forecasts only using an unbiased methodology and our articles are not intended to be financial advice. It does not constitute a recommendation to buy or sell any stock, and does not take account of your objectives, or your financial situation. We aim to bring you long-term focused analysis driven by fundamental data. Note that our analysis may not factor in the latest price-sensitive company announcements or qualitative material. Simply Wall St has no position in any stocks mentioned.
About SEHK:2289
Charmacy Pharmaceutical
Engages in the pharmaceutical distribution business in the People’s Republic of China.
Slight with questionable track record.
