
Advertisement
- Hong Kong
- /
- Healthcare Services
- /
- SEHK:2279
There's Reason For Concern Over Yonghe Medical Group Co., Ltd.'s (HKG:2279) Massive 62% Price Jump
Yonghe Medical Group Co., Ltd. (HKG:2279) shares have continued their recent momentum with a 62% gain in the last month alone. The last month tops off a massive increase of 239% in the last year.
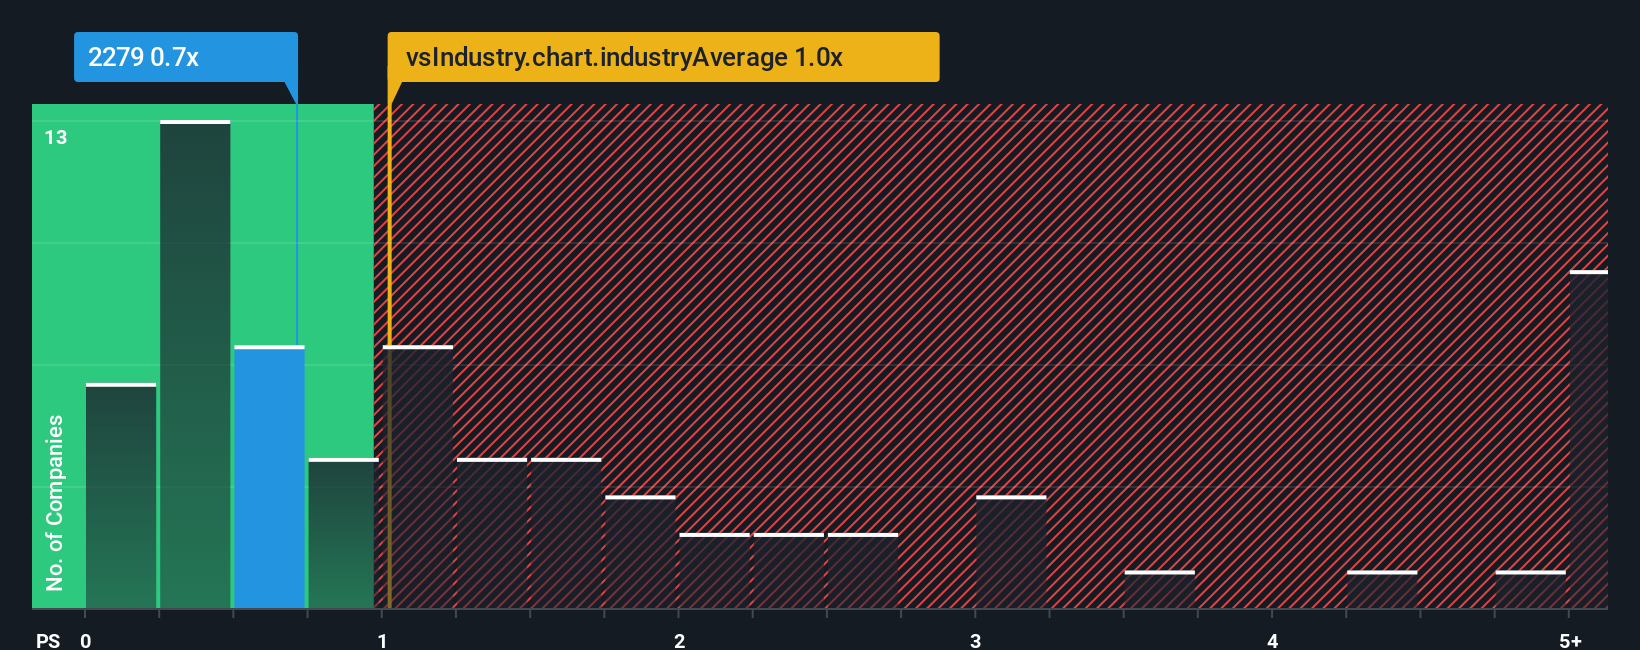
In spite of the firm bounce in price, there still wouldn't be many who think Yonghe Medical Group's price-to-sales (or "P/S") ratio of 0.7x is worth a mention when the median P/S in Hong Kong's Healthcare industry is similar at about 1x. However, investors might be overlooking a clear opportunity or potential setback if there is no rational basis for the P/S.
See our latest analysis for Yonghe Medical Group
What Does Yonghe Medical Group's P/S Mean For Shareholders?
Recent times have been pleasing for Yonghe Medical Group as its revenue has risen in spite of the industry's average revenue going into reverse. It might be that many expect the strong revenue performance to deteriorate like the rest, which has kept the P/S ratio from rising. If you like the company, you'd be hoping this isn't the case so that you could potentially pick up some stock while it's not quite in favour.
If you'd like to see what analysts are forecasting going forward, you should check out our free report on Yonghe Medical Group.Do Revenue Forecasts Match The P/S Ratio?
In order to justify its P/S ratio, Yonghe Medical Group would need to produce growth that's similar to the industry.
If we review the last year of revenue, the company posted a result that saw barely any deviation from a year ago. Whilst it's an improvement, it wasn't enough to get the company out of the hole it was in, with revenue down 17% overall from three years ago. So unfortunately, we have to acknowledge that the company has not done a great job of growing revenue over that time.
Shifting to the future, estimates from the one analyst covering the company suggest revenue should grow by 2.5% over the next year. With the industry predicted to deliver 8.1% growth, the company is positioned for a weaker revenue result.
With this information, we find it interesting that Yonghe Medical Group is trading at a fairly similar P/S compared to the industry. It seems most investors are ignoring the fairly limited growth expectations and are willing to pay up for exposure to the stock. These shareholders may be setting themselves up for future disappointment if the P/S falls to levels more in line with the growth outlook.
The Bottom Line On Yonghe Medical Group's P/S
Its shares have lifted substantially and now Yonghe Medical Group's P/S is back within range of the industry median. We'd say the price-to-sales ratio's power isn't primarily as a valuation instrument but rather to gauge current investor sentiment and future expectations.
Given that Yonghe Medical Group's revenue growth projections are relatively subdued in comparison to the wider industry, it comes as a surprise to see it trading at its current P/S ratio. At present, we aren't confident in the P/S as the predicted future revenues aren't likely to support a more positive sentiment for long. Circumstances like this present a risk to current and prospective investors who may see share prices fall if the low revenue growth impacts the sentiment.
It is also worth noting that we have found 1 warning sign for Yonghe Medical Group that you need to take into consideration.
It's important to make sure you look for a great company, not just the first idea you come across. So if growing profitability aligns with your idea of a great company, take a peek at this free list of interesting companies with strong recent earnings growth (and a low P/E).
New: Manage All Your Stock Portfolios in One Place
We've created the ultimate portfolio companion for stock investors, and it's free.
• Connect an unlimited number of Portfolios and see your total in one currency
• Be alerted to new Warning Signs or Risks via email or mobile
• Track the Fair Value of your stocks
Have feedback on this article? Concerned about the content? Get in touch with us directly. Alternatively, email editorial-team (at) simplywallst.com.
This article by Simply Wall St is general in nature. We provide commentary based on historical data and analyst forecasts only using an unbiased methodology and our articles are not intended to be financial advice. It does not constitute a recommendation to buy or sell any stock, and does not take account of your objectives, or your financial situation. We aim to bring you long-term focused analysis driven by fundamental data. Note that our analysis may not factor in the latest price-sensitive company announcements or qualitative material. Simply Wall St has no position in any stocks mentioned.
About SEHK:2279
Flawless balance sheet and undervalued.
Market Insights

Advertisement
Community Narratives
The company that turned a verb into a global necessity and basically runs the modern internet, digital ads, smartphones, maps, and AI.
Fair Value US$300.00|8.5% undervalued
OS
Community Contributor
Flowers Foods Pays A Fair Price For Health
Fair Value US$16.12|24.6% undervalued
NV
Community Contributor
TMX Group will thrive with 33.3% profit margin and enduring market moat
Fair Value CA$49.90|0.1% undervalued
LI
Community Contributor