
Advertisement
- Hong Kong
- /
- Oil and Gas
- /
- SEHK:8270
It's Down 26% But China CBM Group Company Limited (HKG:8270) Could Be Riskier Than It Looks
China CBM Group Company Limited (HKG:8270) shareholders won't be pleased to see that the share price has had a very rough month, dropping 26% and undoing the prior period's positive performance. The recent drop completes a disastrous twelve months for shareholders, who are sitting on a 54% loss during that time.
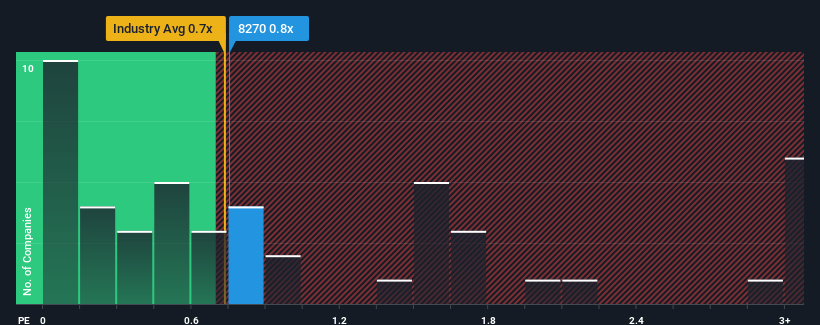
In spite of the heavy fall in price, you could still be forgiven for feeling indifferent about China CBM Group's P/S ratio of 0.8x, since the median price-to-sales (or "P/S") ratio for the Oil and Gas industry in Hong Kong is also close to 0.7x. While this might not raise any eyebrows, if the P/S ratio is not justified investors could be missing out on a potential opportunity or ignoring looming disappointment.
View our latest analysis for China CBM Group
How China CBM Group Has Been Performing
For example, consider that China CBM Group's financial performance has been poor lately as its revenue has been in decline. One possibility is that the P/S is moderate because investors think the company might still do enough to be in line with the broader industry in the near future. If you like the company, you'd at least be hoping this is the case so that you could potentially pick up some stock while it's not quite in favour.
Although there are no analyst estimates available for China CBM Group, take a look at this free data-rich visualisation to see how the company stacks up on earnings, revenue and cash flow.How Is China CBM Group's Revenue Growth Trending?
There's an inherent assumption that a company should be matching the industry for P/S ratios like China CBM Group's to be considered reasonable.
In reviewing the last year of financials, we were disheartened to see the company's revenues fell to the tune of 27%. However, a few very strong years before that means that it was still able to grow revenue by an impressive 34% in total over the last three years. Accordingly, while they would have preferred to keep the run going, shareholders would definitely welcome the medium-term rates of revenue growth.
Comparing that recent medium-term revenue trajectory with the industry's one-year growth forecast of 1.2% shows it's noticeably more attractive.
With this information, we find it interesting that China CBM Group is trading at a fairly similar P/S compared to the industry. Apparently some shareholders believe the recent performance is at its limits and have been accepting lower selling prices.
The Key Takeaway
With its share price dropping off a cliff, the P/S for China CBM Group looks to be in line with the rest of the Oil and Gas industry. It's argued the price-to-sales ratio is an inferior measure of value within certain industries, but it can be a powerful business sentiment indicator.
We didn't quite envision China CBM Group's P/S sitting in line with the wider industry, considering the revenue growth over the last three-year is higher than the current industry outlook. It'd be fair to assume that potential risks the company faces could be the contributing factor to the lower than expected P/S. It appears some are indeed anticipating revenue instability, because the persistence of these recent medium-term conditions would normally provide a boost to the share price.
Having said that, be aware China CBM Group is showing 5 warning signs in our investment analysis, and 1 of those makes us a bit uncomfortable.
If companies with solid past earnings growth is up your alley, you may wish to see this free collection of other companies with strong earnings growth and low P/E ratios.
New: AI Stock Screener & Alerts
Our new AI Stock Screener scans the market every day to uncover opportunities.
• Dividend Powerhouses (3%+ Yield)
• Undervalued Small Caps with Insider Buying
• High growth Tech and AI Companies
Or build your own from over 50 metrics.
Have feedback on this article? Concerned about the content? Get in touch with us directly. Alternatively, email editorial-team (at) simplywallst.com.
This article by Simply Wall St is general in nature. We provide commentary based on historical data and analyst forecasts only using an unbiased methodology and our articles are not intended to be financial advice. It does not constitute a recommendation to buy or sell any stock, and does not take account of your objectives, or your financial situation. We aim to bring you long-term focused analysis driven by fundamental data. Note that our analysis may not factor in the latest price-sensitive company announcements or qualitative material. Simply Wall St has no position in any stocks mentioned.
About SEHK:8270
China CBM Group
An investment holding company, engages in the exploitation, liquefaction production, and sale of natural gas and coalbed gas in the People’s Republic of China.
Mediocre balance sheet and slightly overvalued.
Market Insights

Advertisement
Community Narratives
The company that turned a verb into a global necessity and basically runs the modern internet, digital ads, smartphones, maps, and AI.
Fair Value US$300.00|6.3% undervalued
OS
Community Contributor
Flowers Foods Pays A Fair Price For Health
Fair Value US$16.12|26.0% undervalued
NV
Community Contributor
TMX Group will thrive with 33.3% profit margin and enduring market moat
Fair Value CA$49.90|3.7% overvalued
LI
Community Contributor