
Advertisement
- Hong Kong
- /
- Energy Services
- /
- SEHK:1938
Returns On Capital Are Showing Encouraging Signs At Chu Kong Petroleum and Natural Gas Steel Pipe Holdings (HKG:1938)
Did you know there are some financial metrics that can provide clues of a potential multi-bagger? One common approach is to try and find a company with returns on capital employed (ROCE) that are increasing, in conjunction with a growing amount of capital employed. If you see this, it typically means it's a company with a great business model and plenty of profitable reinvestment opportunities. Speaking of which, we noticed some great changes in Chu Kong Petroleum and Natural Gas Steel Pipe Holdings' (HKG:1938) returns on capital, so let's have a look.
Return On Capital Employed (ROCE): What Is It?
If you haven't worked with ROCE before, it measures the 'return' (pre-tax profit) a company generates from capital employed in its business. The formula for this calculation on Chu Kong Petroleum and Natural Gas Steel Pipe Holdings is:
Return on Capital Employed = Earnings Before Interest and Tax (EBIT) ÷ (Total Assets - Current Liabilities)
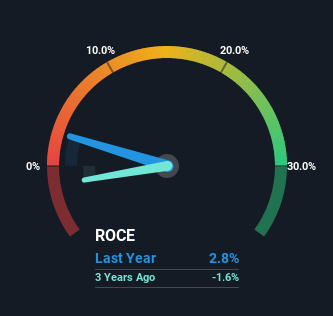
0.028 = CN¥92m ÷ (CN¥7.4b - CN¥4.2b) (Based on the trailing twelve months to June 2022).
Therefore, Chu Kong Petroleum and Natural Gas Steel Pipe Holdings has an ROCE of 2.8%. Ultimately, that's a low return and it under-performs the Energy Services industry average of 7.0%.
See our latest analysis for Chu Kong Petroleum and Natural Gas Steel Pipe Holdings
While the past is not representative of the future, it can be helpful to know how a company has performed historically, which is why we have this chart above. If you're interested in investigating Chu Kong Petroleum and Natural Gas Steel Pipe Holdings' past further, check out this free graph of past earnings, revenue and cash flow.
What The Trend Of ROCE Can Tell Us
We're delighted to see that Chu Kong Petroleum and Natural Gas Steel Pipe Holdings is reaping rewards from its investments and has now broken into profitability. Historically the company was generating losses but as we can see from the latest figures referenced above, they're now earning 2.8% on their capital employed. At first glance, it seems the business is getting more proficient at generating returns, because over the same period, the amount of capital employed has reduced by 35%. Chu Kong Petroleum and Natural Gas Steel Pipe Holdings could be selling under-performing assets since the ROCE is improving.
On a side note, Chu Kong Petroleum and Natural Gas Steel Pipe Holdings' current liabilities are still rather high at 56% of total assets. This can bring about some risks because the company is basically operating with a rather large reliance on its suppliers or other sorts of short-term creditors. Ideally we'd like to see this reduce as that would mean fewer obligations bearing risks.
The Key Takeaway
In the end, Chu Kong Petroleum and Natural Gas Steel Pipe Holdings has proven it's capital allocation skills are good with those higher returns from less amount of capital. Although the company may be facing some issues elsewhere since the stock has plunged 85% in the last five years. Still, it's worth doing some further research to see if the trends will continue into the future.
Since virtually every company faces some risks, it's worth knowing what they are, and we've spotted 4 warning signs for Chu Kong Petroleum and Natural Gas Steel Pipe Holdings (of which 1 makes us a bit uncomfortable!) that you should know about.
While Chu Kong Petroleum and Natural Gas Steel Pipe Holdings may not currently earn the highest returns, we've compiled a list of companies that currently earn more than 25% return on equity. Check out this free list here.
New: AI Stock Screener & Alerts
Our new AI Stock Screener scans the market every day to uncover opportunities.
• Dividend Powerhouses (3%+ Yield)
• Undervalued Small Caps with Insider Buying
• High growth Tech and AI Companies
Or build your own from over 50 metrics.
Have feedback on this article? Concerned about the content? Get in touch with us directly. Alternatively, email editorial-team (at) simplywallst.com.
This article by Simply Wall St is general in nature. We provide commentary based on historical data and analyst forecasts only using an unbiased methodology and our articles are not intended to be financial advice. It does not constitute a recommendation to buy or sell any stock, and does not take account of your objectives, or your financial situation. We aim to bring you long-term focused analysis driven by fundamental data. Note that our analysis may not factor in the latest price-sensitive company announcements or qualitative material. Simply Wall St has no position in any stocks mentioned.
About SEHK:1938
Chu Kong Petroleum and Natural Gas Steel Pipe Holdings
An investment holding company, manufactures and sells longitudinal welded steel pipes in Mainland China, Africa, Europe, the Middle East, rest of Asia, South America, and North America.
Good value with proven track record.
Market Insights

Advertisement
Community Narratives
The company that turned a verb into a global necessity and basically runs the modern internet, digital ads, smartphones, maps, and AI.
Fair Value US$300.00|5.2% undervalued
OS
Community Contributor
Flowers Foods Pays A Fair Price For Health
Fair Value US$16.12|24.9% undervalued
NV
Community Contributor
TMX Group will thrive with 33.3% profit margin and enduring market moat
Fair Value CA$49.90|3.3% overvalued
LI
Community Contributor
The "Molecular Pencil": Why Beam's Technology is Built to Win
Fair Value US$65.01|64.5% undervalued
DA
Community Contributor