
Advertisement
- Hong Kong
- /
- Energy Services
- /
- SEHK:1251
SPT Energy Group's (HKG:1251) Returns On Capital Not Reflecting Well On The Business
If you're looking at a mature business that's past the growth phase, what are some of the underlying trends that pop up? Businesses in decline often have two underlying trends, firstly, a declining return on capital employed (ROCE) and a declining base of capital employed. Trends like this ultimately mean the business is reducing its investments and also earning less on what it has invested. And from a first read, things don't look too good at SPT Energy Group (HKG:1251), so let's see why.
What Is Return On Capital Employed (ROCE)?
Just to clarify if you're unsure, ROCE is a metric for evaluating how much pre-tax income (in percentage terms) a company earns on the capital invested in its business. To calculate this metric for SPT Energy Group, this is the formula:
Return on Capital Employed = Earnings Before Interest and Tax (EBIT) ÷ (Total Assets - Current Liabilities)
0.032 = CN¥45m ÷ (CN¥2.9b - CN¥1.5b) (Based on the trailing twelve months to December 2023).
Therefore, SPT Energy Group has an ROCE of 3.2%. In absolute terms, that's a low return and it also under-performs the Energy Services industry average of 10%.
See our latest analysis for SPT Energy Group
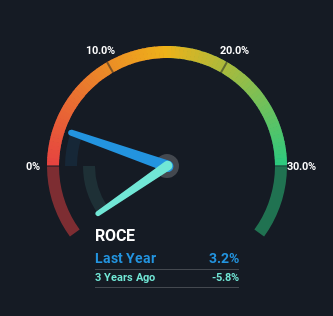
Historical performance is a great place to start when researching a stock so above you can see the gauge for SPT Energy Group's ROCE against it's prior returns. If you're interested in investigating SPT Energy Group's past further, check out this free graph covering SPT Energy Group's past earnings, revenue and cash flow.
What Does the ROCE Trend For SPT Energy Group Tell Us?
We are a bit worried about the trend of returns on capital at SPT Energy Group. To be more specific, the ROCE was 11% five years ago, but since then it has dropped noticeably. Meanwhile, capital employed in the business has stayed roughly the flat over the period. Companies that exhibit these attributes tend to not be shrinking, but they can be mature and facing pressure on their margins from competition. So because these trends aren't typically conducive to creating a multi-bagger, we wouldn't hold our breath on SPT Energy Group becoming one if things continue as they have.
Another thing to note, SPT Energy Group has a high ratio of current liabilities to total assets of 52%. This effectively means that suppliers (or short-term creditors) are funding a large portion of the business, so just be aware that this can introduce some elements of risk. While it's not necessarily a bad thing, it can be beneficial if this ratio is lower.
Our Take On SPT Energy Group's ROCE
All in all, the lower returns from the same amount of capital employed aren't exactly signs of a compounding machine. It should come as no surprise then that the stock has fallen 68% over the last five years, so it looks like investors are recognizing these changes. That being the case, unless the underlying trends revert to a more positive trajectory, we'd consider looking elsewhere.
One more thing to note, we've identified 2 warning signs with SPT Energy Group and understanding them should be part of your investment process.
For those who like to invest in solid companies, check out this free list of companies with solid balance sheets and high returns on equity.
New: Manage All Your Stock Portfolios in One Place
We've created the ultimate portfolio companion for stock investors, and it's free.
• Connect an unlimited number of Portfolios and see your total in one currency
• Be alerted to new Warning Signs or Risks via email or mobile
• Track the Fair Value of your stocks
Have feedback on this article? Concerned about the content? Get in touch with us directly. Alternatively, email editorial-team (at) simplywallst.com.
This article by Simply Wall St is general in nature. We provide commentary based on historical data and analyst forecasts only using an unbiased methodology and our articles are not intended to be financial advice. It does not constitute a recommendation to buy or sell any stock, and does not take account of your objectives, or your financial situation. We aim to bring you long-term focused analysis driven by fundamental data. Note that our analysis may not factor in the latest price-sensitive company announcements or qualitative material. Simply Wall St has no position in any stocks mentioned.
Have feedback on this article? Concerned about the content? Get in touch with us directly. Alternatively, email editorial-team@simplywallst.com
About SEHK:1251
SPT Energy Group
An investment holding company, provides integrated oilfield services in the People's Republic of China, Kazakhstan, Turkmenistan, Canada, Singapore, Indonesia, the Middle East, and internationally.
Excellent balance sheet and slightly overvalued.
Market Insights

Advertisement
Community Narratives
MINISO's fair value is projected at 26.69 with an anticipated PE ratio shift of 20x
Fair Value US$24.03|11.0% undervalued
BE
Community Contributor
Procter & Gamble: A Dividend Giant Facing Slowing Growth
Fair Value US$119.81|23.3% overvalued
AN
Community Contributor
Eli Lilly's Future Growth Driven by Tirzepatide and Favorable Market Conditions
Fair Value US$1.19k|13.8% undervalued
EA
Community Contributor