
Advertisement
- Hong Kong
- /
- Diversified Financial
- /
- SEHK:508
Dingyi Group Investment Limited's (HKG:508) Price Is Right But Growth Is Lacking After Shares Rocket 28%
Those holding Dingyi Group Investment Limited (HKG:508) shares would be relieved that the share price has rebounded 28% in the last thirty days, but it needs to keep going to repair the recent damage it has caused to investor portfolios. Not all shareholders will be feeling jubilant, since the share price is still down a very disappointing 46% in the last twelve months.
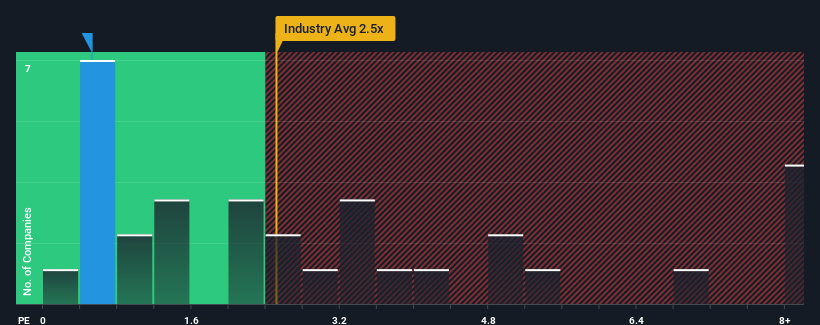
In spite of the firm bounce in price, Dingyi Group Investment may still be sending bullish signals at the moment with its price-to-sales (or "P/S") ratio of 0.5x, since almost half of all companies in the Diversified Financial industry in Hong Kong have P/S ratios greater than 2.5x and even P/S higher than 5x are not unusual. Nonetheless, we'd need to dig a little deeper to determine if there is a rational basis for the reduced P/S.
Check out our latest analysis for Dingyi Group Investment
How Dingyi Group Investment Has Been Performing
As an illustration, revenue has deteriorated at Dingyi Group Investment over the last year, which is not ideal at all. One possibility is that the P/S is low because investors think the company won't do enough to avoid underperforming the broader industry in the near future. Those who are bullish on Dingyi Group Investment will be hoping that this isn't the case so that they can pick up the stock at a lower valuation.
Although there are no analyst estimates available for Dingyi Group Investment, take a look at this free data-rich visualisation to see how the company stacks up on earnings, revenue and cash flow.Is There Any Revenue Growth Forecasted For Dingyi Group Investment?
There's an inherent assumption that a company should underperform the industry for P/S ratios like Dingyi Group Investment's to be considered reasonable.
Retrospectively, the last year delivered a frustrating 67% decrease to the company's top line. Even so, admirably revenue has lifted 56% in aggregate from three years ago, notwithstanding the last 12 months. So we can start by confirming that the company has generally done a very good job of growing revenue over that time, even though it had some hiccups along the way.
Comparing that to the industry, which is predicted to deliver 26% growth in the next 12 months, the company's momentum is weaker, based on recent medium-term annualised revenue results.
In light of this, it's understandable that Dingyi Group Investment's P/S sits below the majority of other companies. It seems most investors are expecting to see the recent limited growth rates continue into the future and are only willing to pay a reduced amount for the stock.
What We Can Learn From Dingyi Group Investment's P/S?
Despite Dingyi Group Investment's share price climbing recently, its P/S still lags most other companies. We'd say the price-to-sales ratio's power isn't primarily as a valuation instrument but rather to gauge current investor sentiment and future expectations.
As we suspected, our examination of Dingyi Group Investment revealed its three-year revenue trends are contributing to its low P/S, given they look worse than current industry expectations. Right now shareholders are accepting the low P/S as they concede future revenue probably won't provide any pleasant surprises. If recent medium-term revenue trends continue, it's hard to see the share price experience a reversal of fortunes anytime soon.
It is also worth noting that we have found 3 warning signs for Dingyi Group Investment that you need to take into consideration.
If you're unsure about the strength of Dingyi Group Investment's business, why not explore our interactive list of stocks with solid business fundamentals for some other companies you may have missed.
New: Manage All Your Stock Portfolios in One Place
We've created the ultimate portfolio companion for stock investors, and it's free.
• Connect an unlimited number of Portfolios and see your total in one currency
• Be alerted to new Warning Signs or Risks via email or mobile
• Track the Fair Value of your stocks
Have feedback on this article? Concerned about the content? Get in touch with us directly. Alternatively, email editorial-team (at) simplywallst.com.
This article by Simply Wall St is general in nature. We provide commentary based on historical data and analyst forecasts only using an unbiased methodology and our articles are not intended to be financial advice. It does not constitute a recommendation to buy or sell any stock, and does not take account of your objectives, or your financial situation. We aim to bring you long-term focused analysis driven by fundamental data. Note that our analysis may not factor in the latest price-sensitive company announcements or qualitative material. Simply Wall St has no position in any stocks mentioned.
About SEHK:508
Dingyi Group Investment
An investment holding company, engages in the loan financing and financial leasing businesses in Mainland China and Hong Kong.
Mediocre balance sheet and slightly overvalued.
Market Insights

Advertisement
Community Narratives
MINISO's fair value is projected at 26.69 with an anticipated PE ratio shift of 20x
Fair Value US$24.03|11.0% undervalued
BE
Community Contributor
Procter & Gamble: A Dividend Giant Facing Slowing Growth
Fair Value US$119.81|23.3% overvalued
AN
Community Contributor
Eli Lilly's Future Growth Driven by Tirzepatide and Favorable Market Conditions
Fair Value US$1.19k|13.8% undervalued
EA
Community Contributor