- Hong Kong
- /
- Capital Markets
- /
- SEHK:1788
Investors who have held Guotai Junan International Holdings (HKG:1788) over the last three years have watched its earnings decline along with their investment


While not a mind-blowing move, it is good to see that the Guotai Junan International Holdings Limited (HKG:1788) share price has gained 16% in the last three months. But that cannot eclipse the less-than-impressive returns over the last three years. In fact, the share price is down 46% in the last three years, falling well short of the market return.
On a more encouraging note the company has added HK$572m to its market cap in just the last 7 days, so let's see if we can determine what's driven the three-year loss for shareholders.
Check out our latest analysis for Guotai Junan International Holdings
There is no denying that markets are sometimes efficient, but prices do not always reflect underlying business performance. One way to examine how market sentiment has changed over time is to look at the interaction between a company's share price and its earnings per share (EPS).
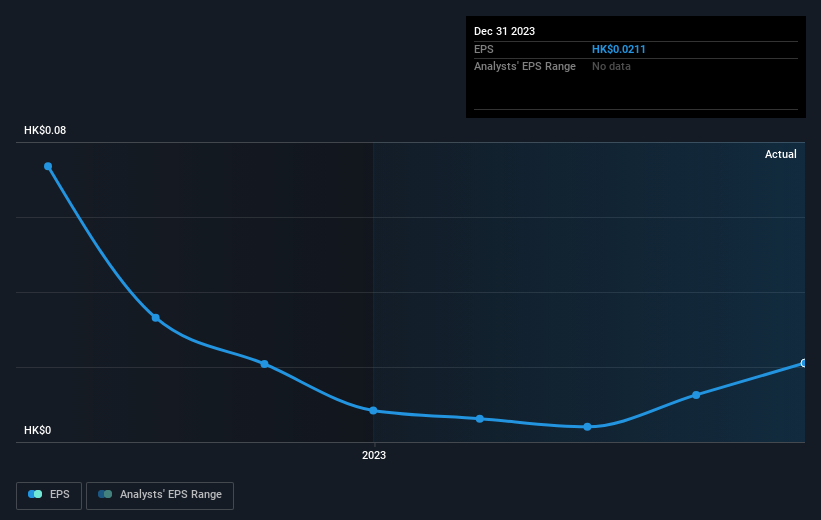
Guotai Junan International Holdings saw its EPS decline at a compound rate of 50% per year, over the last three years. This fall in the EPS is worse than the 19% compound annual share price fall. So the market may not be too worried about the EPS figure, at the moment -- or it may have previously priced some of the drop in.
You can see below how EPS has changed over time (discover the exact values by clicking on the image).
We know that Guotai Junan International Holdings has improved its bottom line lately, but is it going to grow revenue? If you're interested, you could check this free report showing consensus revenue forecasts.
What About Dividends?
When looking at investment returns, it is important to consider the difference between total shareholder return (TSR) and share price return. Whereas the share price return only reflects the change in the share price, the TSR includes the value of dividends (assuming they were reinvested) and the benefit of any discounted capital raising or spin-off. It's fair to say that the TSR gives a more complete picture for stocks that pay a dividend. As it happens, Guotai Junan International Holdings' TSR for the last 3 years was -38%, which exceeds the share price return mentioned earlier. And there's no prize for guessing that the dividend payments largely explain the divergence!
A Different Perspective
It's nice to see that Guotai Junan International Holdings shareholders have received a total shareholder return of 6.4% over the last year. Of course, that includes the dividend. Notably the five-year annualised TSR loss of 5% per year compares very unfavourably with the recent share price performance. We generally put more weight on the long term performance over the short term, but the recent improvement could hint at a (positive) inflection point within the business. It's always interesting to track share price performance over the longer term. But to understand Guotai Junan International Holdings better, we need to consider many other factors. For instance, we've identified 2 warning signs for Guotai Junan International Holdings that you should be aware of.
If you like to buy stocks alongside management, then you might just love this free list of companies. (Hint: many of them are unnoticed AND have attractive valuation).
Please note, the market returns quoted in this article reflect the market weighted average returns of stocks that currently trade on Hong Kong exchanges.
New: Manage All Your Stock Portfolios in One Place
We've created the ultimate portfolio companion for stock investors, and it's free.
• Connect an unlimited number of Portfolios and see your total in one currency
• Be alerted to new Warning Signs or Risks via email or mobile
• Track the Fair Value of your stocks
Have feedback on this article? Concerned about the content? Get in touch with us directly. Alternatively, email editorial-team (at) simplywallst.com.
This article by Simply Wall St is general in nature. We provide commentary based on historical data and analyst forecasts only using an unbiased methodology and our articles are not intended to be financial advice. It does not constitute a recommendation to buy or sell any stock, and does not take account of your objectives, or your financial situation. We aim to bring you long-term focused analysis driven by fundamental data. Note that our analysis may not factor in the latest price-sensitive company announcements or qualitative material. Simply Wall St has no position in any stocks mentioned.
Have feedback on this article? Concerned about the content? Get in touch with us directly. Alternatively, email editorial-team@simplywallst.com
About SEHK:1788
Guotai Junan International Holdings
An investment holding company, provides brokerage, corporate finance, asset management, loans and financing, financial products, market making, and investment services in Hong Kong and internationally.
Acceptable track record with mediocre balance sheet.
