- Hong Kong
- /
- Consumer Finance
- /
- SEHK:1543
Guangdong Join-Share Financing Guarantee Investment (HKG:1543) sheds HK$172m, company earnings and investor returns have been trending downwards for past three years


The truth is that if you invest for long enough, you're going to end up with some losing stocks. But long term Guangdong Join-Share Financing Guarantee Investment Co., Ltd. (HKG:1543) shareholders have had a particularly rough ride in the last three year. Regrettably, they have had to cope with a 65% drop in the share price over that period. More recently, the share price has dropped a further 19% in a month.
Since Guangdong Join-Share Financing Guarantee Investment has shed HK$172m from its value in the past 7 days, let's see if the longer term decline has been driven by the business' economics.
View our latest analysis for Guangdong Join-Share Financing Guarantee Investment
While the efficient markets hypothesis continues to be taught by some, it has been proven that markets are over-reactive dynamic systems, and investors are not always rational. One imperfect but simple way to consider how the market perception of a company has shifted is to compare the change in the earnings per share (EPS) with the share price movement.
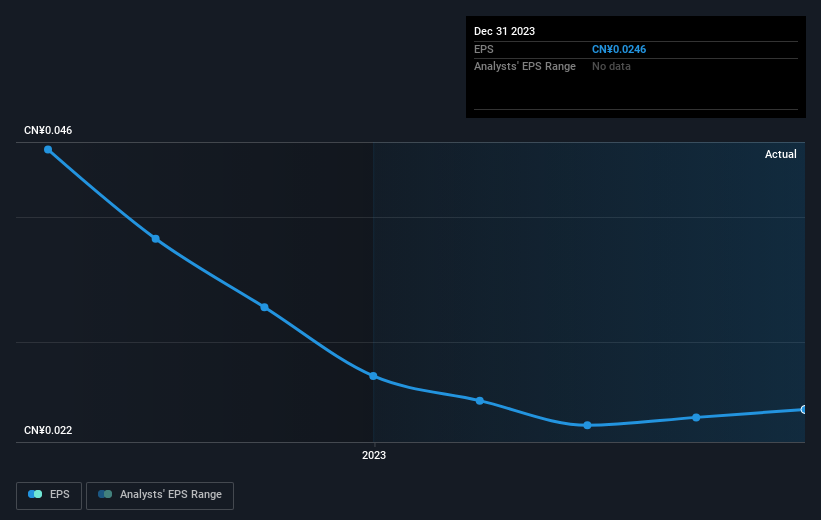
Guangdong Join-Share Financing Guarantee Investment saw its EPS decline at a compound rate of 29% per year, over the last three years. So do you think it's a coincidence that the share price has dropped 30% per year, a very similar rate to the EPS? We don't. So it seems that investor expectations of the company are staying pretty steady, despite the disappointment. In this case, it seems that the EPS is guiding the share price.
You can see how EPS has changed over time in the image below (click on the chart to see the exact values).
We consider it positive that insiders have made significant purchases in the last year. Even so, future earnings will be far more important to whether current shareholders make money. Dive deeper into the earnings by checking this interactive graph of Guangdong Join-Share Financing Guarantee Investment's earnings, revenue and cash flow.
What About Dividends?
It is important to consider the total shareholder return, as well as the share price return, for any given stock. The TSR incorporates the value of any spin-offs or discounted capital raisings, along with any dividends, based on the assumption that the dividends are reinvested. It's fair to say that the TSR gives a more complete picture for stocks that pay a dividend. We note that for Guangdong Join-Share Financing Guarantee Investment the TSR over the last 3 years was -62%, which is better than the share price return mentioned above. This is largely a result of its dividend payments!
A Different Perspective
Guangdong Join-Share Financing Guarantee Investment provided a TSR of 0.9% over the last twelve months. Unfortunately this falls short of the market return. On the bright side, that's still a gain, and it is certainly better than the yearly loss of about 9% endured over half a decade. It could well be that the business is stabilizing. It's always interesting to track share price performance over the longer term. But to understand Guangdong Join-Share Financing Guarantee Investment better, we need to consider many other factors. Case in point: We've spotted 2 warning signs for Guangdong Join-Share Financing Guarantee Investment you should be aware of, and 1 of them is significant.
Guangdong Join-Share Financing Guarantee Investment is not the only stock that insiders are buying. For those who like to find lesser know companies this free list of growing companies with recent insider purchasing, could be just the ticket.
Please note, the market returns quoted in this article reflect the market weighted average returns of stocks that currently trade on Hong Kong exchanges.
New: Manage All Your Stock Portfolios in One Place
We've created the ultimate portfolio companion for stock investors, and it's free.
• Connect an unlimited number of Portfolios and see your total in one currency
• Be alerted to new Warning Signs or Risks via email or mobile
• Track the Fair Value of your stocks
Have feedback on this article? Concerned about the content? Get in touch with us directly. Alternatively, email editorial-team (at) simplywallst.com.
This article by Simply Wall St is general in nature. We provide commentary based on historical data and analyst forecasts only using an unbiased methodology and our articles are not intended to be financial advice. It does not constitute a recommendation to buy or sell any stock, and does not take account of your objectives, or your financial situation. We aim to bring you long-term focused analysis driven by fundamental data. Note that our analysis may not factor in the latest price-sensitive company announcements or qualitative material. Simply Wall St has no position in any stocks mentioned.
About SEHK:1543
Guangdong Join-Share Financing Guarantee Investment
Provides credit-based financing solutions to small and medium-sized enterprises (SMEs) for their financing and business needs in the People’s Republic of China.
Proven track record slight.
