- Hong Kong
- /
- Capital Markets
- /
- SEHK:1428
Bright Smart Securities & Commodities Group (HKG:1428) jumps 12% this week, though earnings growth is still tracking behind five-year shareholder returns


Stock pickers are generally looking for stocks that will outperform the broader market. And while active stock picking involves risks (and requires diversification) it can also provide excess returns. For example, long term Bright Smart Securities & Commodities Group Limited (HKG:1428) shareholders have enjoyed a 45% share price rise over the last half decade, well in excess of the market decline of around 8.0% (not including dividends). On the other hand, the more recent gains haven't been so impressive, with shareholders gaining just 50%, including dividends.
The past week has proven to be lucrative for Bright Smart Securities & Commodities Group investors, so let's see if fundamentals drove the company's five-year performance.
Check out our latest analysis for Bright Smart Securities & Commodities Group
There is no denying that markets are sometimes efficient, but prices do not always reflect underlying business performance. One way to examine how market sentiment has changed over time is to look at the interaction between a company's share price and its earnings per share (EPS).
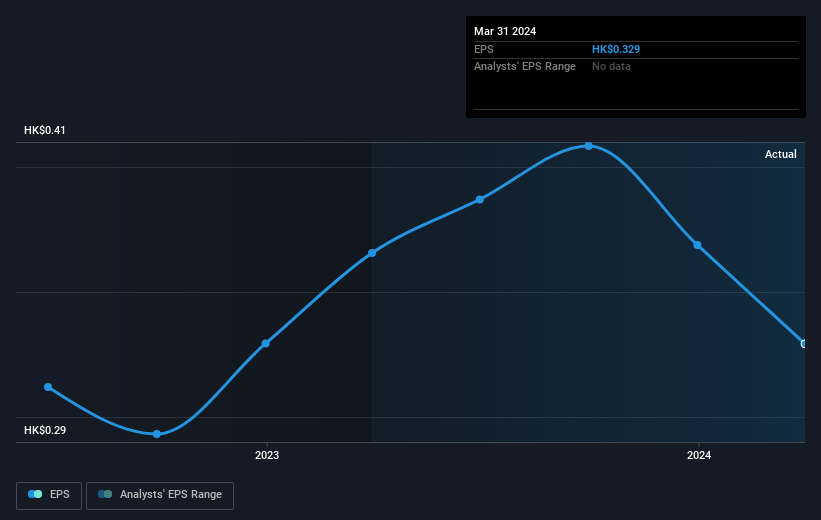
During five years of share price growth, Bright Smart Securities & Commodities Group achieved compound earnings per share (EPS) growth of 4.9% per year. This EPS growth is slower than the share price growth of 8% per year, over the same period. This suggests that market participants hold the company in higher regard, these days. That's not necessarily surprising considering the five-year track record of earnings growth.
The company's earnings per share (over time) is depicted in the image below (click to see the exact numbers).
Before buying or selling a stock, we always recommend a close examination of historic growth trends, available here.
What About Dividends?
It is important to consider the total shareholder return, as well as the share price return, for any given stock. Whereas the share price return only reflects the change in the share price, the TSR includes the value of dividends (assuming they were reinvested) and the benefit of any discounted capital raising or spin-off. So for companies that pay a generous dividend, the TSR is often a lot higher than the share price return. We note that for Bright Smart Securities & Commodities Group the TSR over the last 5 years was 710%, which is better than the share price return mentioned above. And there's no prize for guessing that the dividend payments largely explain the divergence!
A Different Perspective
It's good to see that Bright Smart Securities & Commodities Group has rewarded shareholders with a total shareholder return of 50% in the last twelve months. Of course, that includes the dividend. Having said that, the five-year TSR of 52% a year, is even better. While it is well worth considering the different impacts that market conditions can have on the share price, there are other factors that are even more important. To that end, you should be aware of the 3 warning signs we've spotted with Bright Smart Securities & Commodities Group .
Of course, you might find a fantastic investment by looking elsewhere. So take a peek at this free list of companies we expect will grow earnings.
Please note, the market returns quoted in this article reflect the market weighted average returns of stocks that currently trade on Hong Kong exchanges.
Valuation is complex, but we're here to simplify it.
Discover if Bright Smart Securities & Commodities Group might be undervalued or overvalued with our detailed analysis, featuring fair value estimates, potential risks, dividends, insider trades, and its financial condition.
Access Free AnalysisHave feedback on this article? Concerned about the content? Get in touch with us directly. Alternatively, email editorial-team (at) simplywallst.com.
This article by Simply Wall St is general in nature. We provide commentary based on historical data and analyst forecasts only using an unbiased methodology and our articles are not intended to be financial advice. It does not constitute a recommendation to buy or sell any stock, and does not take account of your objectives, or your financial situation. We aim to bring you long-term focused analysis driven by fundamental data. Note that our analysis may not factor in the latest price-sensitive company announcements or qualitative material. Simply Wall St has no position in any stocks mentioned.
About SEHK:1428
Bright Smart Securities & Commodities Group
An investment holding company, provides financial services in Hong Kong.
Good value average dividend payer.

