
Advertisement
- Hong Kong
- /
- Hospitality
- /
- SEHK:880
Optimistic Investors Push SJM Holdings Limited (HKG:880) Shares Up 27% But Growth Is Lacking
Despite an already strong run, SJM Holdings Limited (HKG:880) shares have been powering on, with a gain of 27% in the last thirty days. Taking a wider view, although not as strong as the last month, the full year gain of 23% is also fairly reasonable.
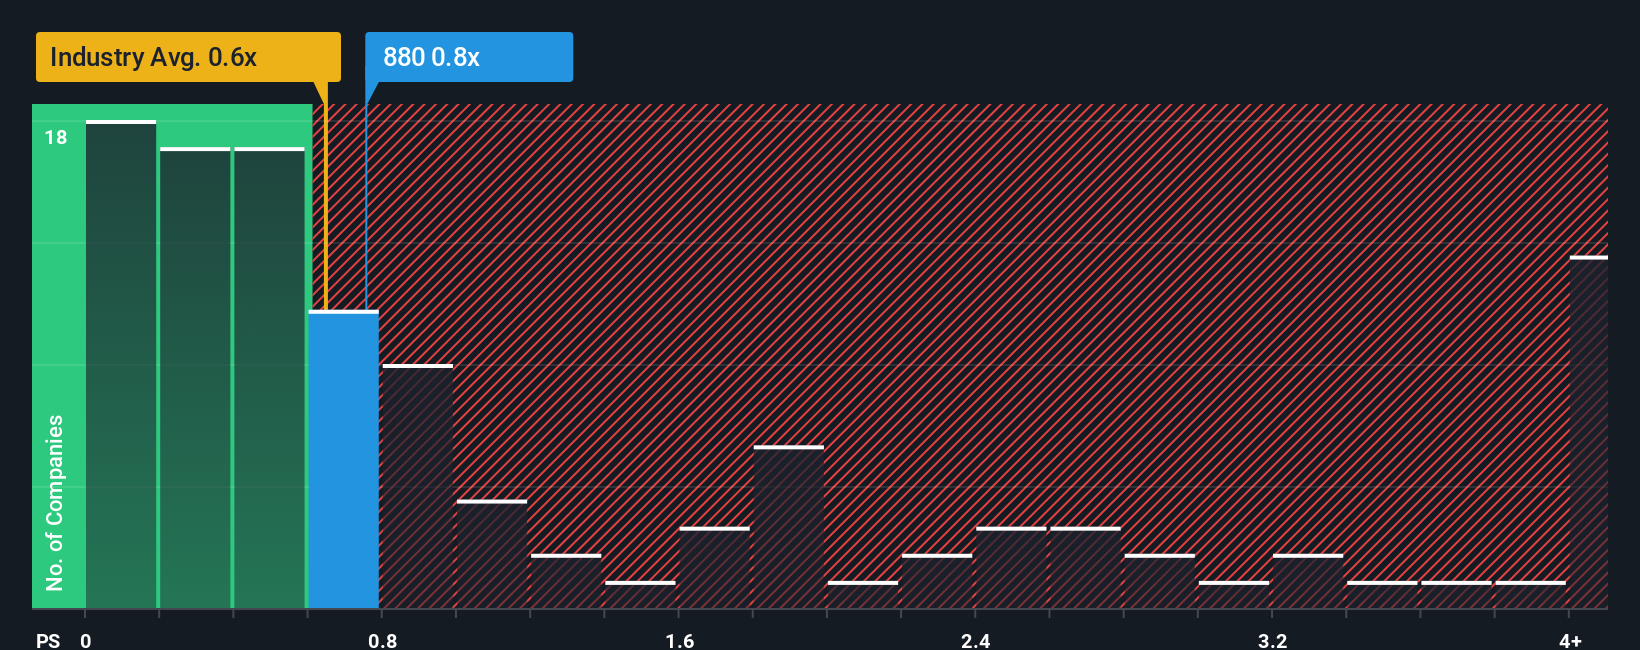
In spite of the firm bounce in price, it's still not a stretch to say that SJM Holdings' price-to-sales (or "P/S") ratio of 0.8x right now seems quite "middle-of-the-road" compared to the Hospitality industry in Hong Kong, where the median P/S ratio is around 0.6x. However, investors might be overlooking a clear opportunity or potential setback if there is no rational basis for the P/S.
See our latest analysis for SJM Holdings
How SJM Holdings Has Been Performing
SJM Holdings certainly has been doing a good job lately as it's been growing revenue more than most other companies. One possibility is that the P/S ratio is moderate because investors think this strong revenue performance might be about to tail off. If not, then existing shareholders have reason to be feeling optimistic about the future direction of the share price.
If you'd like to see what analysts are forecasting going forward, you should check out our free report on SJM Holdings.What Are Revenue Growth Metrics Telling Us About The P/S?
SJM Holdings' P/S ratio would be typical for a company that's only expected to deliver moderate growth, and importantly, perform in line with the industry.
Retrospectively, the last year delivered an exceptional 33% gain to the company's top line. The latest three year period has also seen an excellent 186% overall rise in revenue, aided by its short-term performance. Accordingly, shareholders would have definitely welcomed those medium-term rates of revenue growth.
Shifting to the future, estimates from the ten analysts covering the company suggest revenue should grow by 3.0% per annum over the next three years. Meanwhile, the rest of the industry is forecast to expand by 13% per annum, which is noticeably more attractive.
With this information, we find it interesting that SJM Holdings is trading at a fairly similar P/S compared to the industry. It seems most investors are ignoring the fairly limited growth expectations and are willing to pay up for exposure to the stock. These shareholders may be setting themselves up for future disappointment if the P/S falls to levels more in line with the growth outlook.
What We Can Learn From SJM Holdings' P/S?
SJM Holdings appears to be back in favour with a solid price jump bringing its P/S back in line with other companies in the industry It's argued the price-to-sales ratio is an inferior measure of value within certain industries, but it can be a powerful business sentiment indicator.
Given that SJM Holdings' revenue growth projections are relatively subdued in comparison to the wider industry, it comes as a surprise to see it trading at its current P/S ratio. At present, we aren't confident in the P/S as the predicted future revenues aren't likely to support a more positive sentiment for long. This places shareholders' investments at risk and potential investors in danger of paying an unnecessary premium.
Plus, you should also learn about this 1 warning sign we've spotted with SJM Holdings.
If companies with solid past earnings growth is up your alley, you may wish to see this free collection of other companies with strong earnings growth and low P/E ratios.
New: Manage All Your Stock Portfolios in One Place
We've created the ultimate portfolio companion for stock investors, and it's free.
• Connect an unlimited number of Portfolios and see your total in one currency
• Be alerted to new Warning Signs or Risks via email or mobile
• Track the Fair Value of your stocks
Have feedback on this article? Concerned about the content? Get in touch with us directly. Alternatively, email editorial-team (at) simplywallst.com.
This article by Simply Wall St is general in nature. We provide commentary based on historical data and analyst forecasts only using an unbiased methodology and our articles are not intended to be financial advice. It does not constitute a recommendation to buy or sell any stock, and does not take account of your objectives, or your financial situation. We aim to bring you long-term focused analysis driven by fundamental data. Note that our analysis may not factor in the latest price-sensitive company announcements or qualitative material. Simply Wall St has no position in any stocks mentioned.
About SEHK:880
SJM Holdings
An investment holding company, owns, develops, and operates casinos and integrated entertainment resorts in Macau.
Undervalued with moderate growth potential.
Similar Companies
Market Insights

Advertisement
Community Narratives
MINISO's fair value is projected at 26.69 with an anticipated PE ratio shift of 20x
Fair Value US$24.03|11.0% undervalued
BE
Community Contributor
Procter & Gamble: A Dividend Giant Facing Slowing Growth
Fair Value US$119.81|23.3% overvalued
AN
Community Contributor
Eli Lilly's Future Growth Driven by Tirzepatide and Favorable Market Conditions
Fair Value US$1.19k|13.8% undervalued
EA
Community Contributor