
Advertisement
Legendary fund manager Li Lu (who Charlie Munger backed) once said, 'The biggest investment risk is not the volatility of prices, but whether you will suffer a permanent loss of capital.' So it seems the smart money knows that debt - which is usually involved in bankruptcies - is a very important factor, when you assess how risky a company is. We can see that SJM Holdings Limited (HKG:880) does use debt in its business. But the more important question is: how much risk is that debt creating?
When Is Debt Dangerous?
Debt assists a business until the business has trouble paying it off, either with new capital or with free cash flow. Part and parcel of capitalism is the process of 'creative destruction' where failed businesses are mercilessly liquidated by their bankers. While that is not too common, we often do see indebted companies permanently diluting shareholders because lenders force them to raise capital at a distressed price. Of course, debt can be an important tool in businesses, particularly capital heavy businesses. The first step when considering a company's debt levels is to consider its cash and debt together.
Check out our latest analysis for SJM Holdings
What Is SJM Holdings's Net Debt?
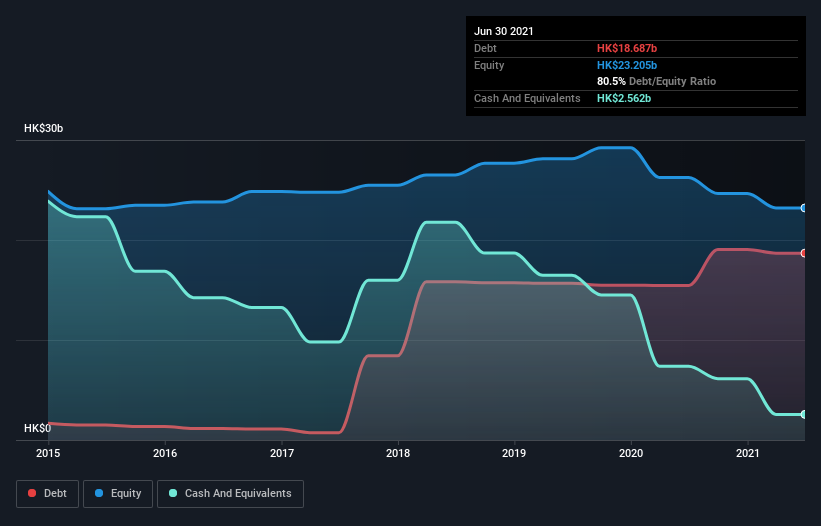
The image below, which you can click on for greater detail, shows that at June 2021 SJM Holdings had debt of HK$18.7b, up from HK$15.5b in one year. However, it does have HK$2.56b in cash offsetting this, leading to net debt of about HK$16.1b.
A Look At SJM Holdings' Liabilities
According to the last reported balance sheet, SJM Holdings had liabilities of HK$15.8b due within 12 months, and liabilities of HK$10.5b due beyond 12 months. Offsetting this, it had HK$2.56b in cash and HK$515.8m in receivables that were due within 12 months. So it has liabilities totalling HK$23.3b more than its cash and near-term receivables, combined.
This deficit is considerable relative to its market capitalization of HK$33.2b, so it does suggest shareholders should keep an eye on SJM Holdings' use of debt. Should its lenders demand that it shore up the balance sheet, shareholders would likely face severe dilution. When analysing debt levels, the balance sheet is the obvious place to start. But ultimately the future profitability of the business will decide if SJM Holdings can strengthen its balance sheet over time. So if you want to see what the professionals think, you might find this free report on analyst profit forecasts to be interesting.
Over 12 months, SJM Holdings made a loss at the EBIT level, and saw its revenue drop to HK$8.4b, which is a fall of 61%. To be frank that doesn't bode well.
Caveat Emptor
Not only did SJM Holdings's revenue slip over the last twelve months, but it also produced negative earnings before interest and tax (EBIT). To be specific the EBIT loss came in at HK$3.3b. When we look at that and recall the liabilities on its balance sheet, relative to cash, it seems unwise to us for the company to have any debt. So we think its balance sheet is a little strained, though not beyond repair. Another cause for caution is that is bled HK$7.4b in negative free cash flow over the last twelve months. So suffice it to say we consider the stock very risky. The balance sheet is clearly the area to focus on when you are analysing debt. However, not all investment risk resides within the balance sheet - far from it. These risks can be hard to spot. Every company has them, and we've spotted 2 warning signs for SJM Holdings (of which 1 is a bit unpleasant!) you should know about.
At the end of the day, it's often better to focus on companies that are free from net debt. You can access our special list of such companies (all with a track record of profit growth). It's free.
New: Manage All Your Stock Portfolios in One Place
We've created the ultimate portfolio companion for stock investors, and it's free.
• Connect an unlimited number of Portfolios and see your total in one currency
• Be alerted to new Warning Signs or Risks via email or mobile
• Track the Fair Value of your stocks
This article by Simply Wall St is general in nature. We provide commentary based on historical data and analyst forecasts only using an unbiased methodology and our articles are not intended to be financial advice. It does not constitute a recommendation to buy or sell any stock, and does not take account of your objectives, or your financial situation. We aim to bring you long-term focused analysis driven by fundamental data. Note that our analysis may not factor in the latest price-sensitive company announcements or qualitative material. Simply Wall St has no position in any stocks mentioned.
Have feedback on this article? Concerned about the content? Get in touch with us directly. Alternatively, email editorial-team (at) simplywallst.com.
About SEHK:880
SJM Holdings
An investment holding company, owns, develops, and operates casinos and integrated entertainment resorts in Macau.
Undervalued with moderate growth potential.
Similar Companies
Market Insights

Advertisement
Community Narratives
MINISO's fair value is projected at 26.69 with an anticipated PE ratio shift of 20x
Fair Value US$24.03|11.0% undervalued
BE
Community Contributor
Procter & Gamble: A Dividend Giant Facing Slowing Growth
Fair Value US$119.81|23.3% overvalued
AN
Community Contributor
Eli Lilly's Future Growth Driven by Tirzepatide and Favorable Market Conditions
Fair Value US$1.19k|13.8% undervalued
EA
Community Contributor