
Advertisement
- Hong Kong
- /
- Hospitality
- /
- SEHK:8432
Bar Pacific Group Holdings' (HKG:8432) Returns On Capital Tell Us There Is Reason To Feel Uneasy
If you're looking at a mature business that's past the growth phase, what are some of the underlying trends that pop up? Typically, we'll see the trend of both return on capital employed (ROCE) declining and this usually coincides with a decreasing amount of capital employed. Trends like this ultimately mean the business is reducing its investments and also earning less on what it has invested. So after glancing at the trends within Bar Pacific Group Holdings (HKG:8432), we weren't too hopeful.
Understanding Return On Capital Employed (ROCE)
For those who don't know, ROCE is a measure of a company's yearly pre-tax profit (its return), relative to the capital employed in the business. The formula for this calculation on Bar Pacific Group Holdings is:
Return on Capital Employed = Earnings Before Interest and Tax (EBIT) ÷ (Total Assets - Current Liabilities)
0.078 = HK$6.5m ÷ (HK$199m - HK$115m) (Based on the trailing twelve months to September 2023).
Therefore, Bar Pacific Group Holdings has an ROCE of 7.8%. In absolute terms, that's a low return, but it's much better than the Hospitality industry average of 4.3%.
Check out our latest analysis for Bar Pacific Group Holdings
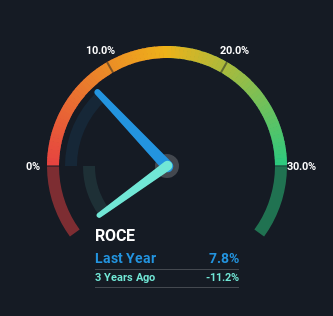
Historical performance is a great place to start when researching a stock so above you can see the gauge for Bar Pacific Group Holdings' ROCE against it's prior returns. If you want to delve into the historical earnings, revenue and cash flow of Bar Pacific Group Holdings, check out these free graphs here.
What Can We Tell From Bar Pacific Group Holdings' ROCE Trend?
There is reason to be cautious about Bar Pacific Group Holdings, given the returns are trending downwards. About five years ago, returns on capital were 10%, however they're now substantially lower than that as we saw above. On top of that, it's worth noting that the amount of capital employed within the business has remained relatively steady. Since returns are falling and the business has the same amount of assets employed, this can suggest it's a mature business that hasn't had much growth in the last five years. If these trends continue, we wouldn't expect Bar Pacific Group Holdings to turn into a multi-bagger.
On a side note, Bar Pacific Group Holdings' current liabilities have increased over the last five years to 58% of total assets, effectively distorting the ROCE to some degree. Without this increase, it's likely that ROCE would be even lower than 7.8%. And with current liabilities at these levels, suppliers or short-term creditors are effectively funding a large part of the business, which can introduce some risks.
Our Take On Bar Pacific Group Holdings' ROCE
All in all, the lower returns from the same amount of capital employed aren't exactly signs of a compounding machine. It should come as no surprise then that the stock has fallen 21% over the last five years, so it looks like investors are recognizing these changes. That being the case, unless the underlying trends revert to a more positive trajectory, we'd consider looking elsewhere.
If you'd like to know more about Bar Pacific Group Holdings, we've spotted 3 warning signs, and 2 of them are a bit concerning.
If you want to search for solid companies with great earnings, check out this free list of companies with good balance sheets and impressive returns on equity.
Valuation is complex, but we're here to simplify it.
Discover if Bar Pacific Group Holdings might be undervalued or overvalued with our detailed analysis, featuring fair value estimates, potential risks, dividends, insider trades, and its financial condition.
Access Free AnalysisHave feedback on this article? Concerned about the content? Get in touch with us directly. Alternatively, email editorial-team (at) simplywallst.com.
This article by Simply Wall St is general in nature. We provide commentary based on historical data and analyst forecasts only using an unbiased methodology and our articles are not intended to be financial advice. It does not constitute a recommendation to buy or sell any stock, and does not take account of your objectives, or your financial situation. We aim to bring you long-term focused analysis driven by fundamental data. Note that our analysis may not factor in the latest price-sensitive company announcements or qualitative material. Simply Wall St has no position in any stocks mentioned.
About SEHK:8432
Bar Pacific Group Holdings
An investment holding company, operates a chain of bars and restaurants under the Bar Pacific, Pacific, Moon Ocean, and Katachi brands in Hong Kong and People’s Republic of China.
Good value with imperfect balance sheet.
Market Insights

Advertisement
Community Narratives
The company that turned a verb into a global necessity and basically runs the modern internet, digital ads, smartphones, maps, and AI.
Fair Value US$300.00|6.2% undervalued
OS
Community Contributor
Flowers Foods Pays A Fair Price For Health
Fair Value US$16.12|25.1% undervalued
NV
Community Contributor
TMX Group will thrive with 33.3% profit margin and enduring market moat
Fair Value CA$49.90|0.04% overvalued
LI
Community Contributor