
Advertisement
- Hong Kong
- /
- Hospitality
- /
- SEHK:542
Returns on Capital Paint A Bright Future For TFG International Group (HKG:542)
If you're not sure where to start when looking for the next multi-bagger, there are a few key trends you should keep an eye out for. Amongst other things, we'll want to see two things; firstly, a growing return on capital employed (ROCE) and secondly, an expansion in the company's amount of capital employed. If you see this, it typically means it's a company with a great business model and plenty of profitable reinvestment opportunities. And in light of that, the trends we're seeing at TFG International Group's (HKG:542) look very promising so lets take a look.
What Is Return On Capital Employed (ROCE)?
If you haven't worked with ROCE before, it measures the 'return' (pre-tax profit) a company generates from capital employed in its business. To calculate this metric for TFG International Group, this is the formula:
Return on Capital Employed = Earnings Before Interest and Tax (EBIT) ÷ (Total Assets - Current Liabilities)
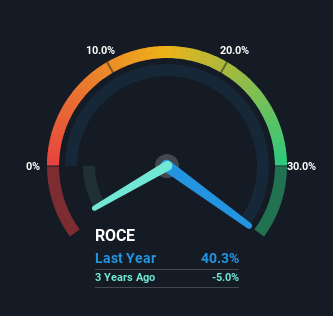
0.40 = HK$514m ÷ (HK$3.4b - HK$2.1b) (Based on the trailing twelve months to June 2023).
Thus, TFG International Group has an ROCE of 40%. That's a fantastic return and not only that, it outpaces the average of 3.5% earned by companies in a similar industry.
View our latest analysis for TFG International Group
While the past is not representative of the future, it can be helpful to know how a company has performed historically, which is why we have this chart above. If you're interested in investigating TFG International Group's past further, check out this free graph of past earnings, revenue and cash flow.
How Are Returns Trending?
Shareholders will be relieved that TFG International Group has broken into profitability. The company now earns 40% on its capital, because five years ago it was incurring losses. Interestingly, the capital employed by the business has remained relatively flat, so these higher returns are either from prior investments paying off or increased efficiencies. So while we're happy that the business is more efficient, just keep in mind that could mean that going forward the business is lacking areas to invest internally for growth. Because in the end, a business can only get so efficient.
For the record though, there was a noticeable increase in the company's current liabilities over the period, so we would attribute some of the ROCE growth to that. Effectively this means that suppliers or short-term creditors are now funding 62% of the business, which is more than it was five years ago. And with current liabilities at those levels, that's pretty high.
In Conclusion...
In summary, we're delighted to see that TFG International Group has been able to increase efficiencies and earn higher rates of return on the same amount of capital. And since the stock has fallen 18% over the last five years, there might be an opportunity here. That being the case, research into the company's current valuation metrics and future prospects seems fitting.
If you want to know some of the risks facing TFG International Group we've found 2 warning signs (1 can't be ignored!) that you should be aware of before investing here.
If you want to search for more stocks that have been earning high returns, check out this free list of stocks with solid balance sheets that are also earning high returns on equity.
New: AI Stock Screener & Alerts
Our new AI Stock Screener scans the market every day to uncover opportunities.
• Dividend Powerhouses (3%+ Yield)
• Undervalued Small Caps with Insider Buying
• High growth Tech and AI Companies
Or build your own from over 50 metrics.
Have feedback on this article? Concerned about the content? Get in touch with us directly. Alternatively, email editorial-team (at) simplywallst.com.
This article by Simply Wall St is general in nature. We provide commentary based on historical data and analyst forecasts only using an unbiased methodology and our articles are not intended to be financial advice. It does not constitute a recommendation to buy or sell any stock, and does not take account of your objectives, or your financial situation. We aim to bring you long-term focused analysis driven by fundamental data. Note that our analysis may not factor in the latest price-sensitive company announcements or qualitative material. Simply Wall St has no position in any stocks mentioned.
About SEHK:542
China Cultural Tourism and Agriculture Group
Engages in the property development, hotel businesses, and trading of food and beverages in the People’s Republic of China.
Fair value with imperfect balance sheet.
Market Insights

Advertisement
Community Narratives
The company that turned a verb into a global necessity and basically runs the modern internet, digital ads, smartphones, maps, and AI.
Fair Value US$300.00|7.5% undervalued
OS
Community Contributor
Flowers Foods Pays A Fair Price For Health
Fair Value US$16.12|25.4% undervalued
NV
Community Contributor
TMX Group will thrive with 33.3% profit margin and enduring market moat
Fair Value CA$49.90|3.6% overvalued
LI
Community Contributor
The "Molecular Pencil": Why Beam's Technology is Built to Win
Fair Value US$65.01|65.0% undervalued
DA
Community Contributor