
Advertisement
- Hong Kong
- /
- Hospitality
- /
- SEHK:3666
Shanghai XNG Holdings Limited (HKG:3666) Held Back By Insufficient Growth Even After Shares Climb 29%
Shanghai XNG Holdings Limited (HKG:3666) shares have had a really impressive month, gaining 29% after a shaky period beforehand. Still, the 30-day jump doesn't change the fact that longer term shareholders have seen their stock decimated by the 50% share price drop in the last twelve months.
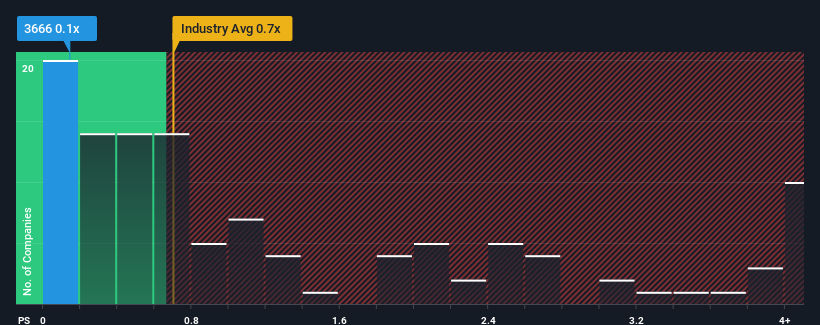
In spite of the firm bounce in price, Shanghai XNG Holdings' price-to-sales (or "P/S") ratio of 0.1x might still make it look like a buy right now compared to the Hospitality industry in Hong Kong, where around half of the companies have P/S ratios above 0.7x and even P/S above 3x are quite common. Nonetheless, we'd need to dig a little deeper to determine if there is a rational basis for the reduced P/S.
View our latest analysis for Shanghai XNG Holdings
What Does Shanghai XNG Holdings' P/S Mean For Shareholders?
As an illustration, revenue has deteriorated at Shanghai XNG Holdings over the last year, which is not ideal at all. One possibility is that the P/S is low because investors think the company won't do enough to avoid underperforming the broader industry in the near future. If you like the company, you'd be hoping this isn't the case so that you could potentially pick up some stock while it's out of favour.
Want the full picture on earnings, revenue and cash flow for the company? Then our free report on Shanghai XNG Holdings will help you shine a light on its historical performance.Is There Any Revenue Growth Forecasted For Shanghai XNG Holdings?
There's an inherent assumption that a company should underperform the industry for P/S ratios like Shanghai XNG Holdings' to be considered reasonable.
Retrospectively, the last year delivered a frustrating 7.6% decrease to the company's top line. As a result, revenue from three years ago have also fallen 50% overall. Accordingly, shareholders would have felt downbeat about the medium-term rates of revenue growth.
Weighing that medium-term revenue trajectory against the broader industry's one-year forecast for expansion of 15% shows it's an unpleasant look.
In light of this, it's understandable that Shanghai XNG Holdings' P/S would sit below the majority of other companies. However, we think shrinking revenues are unlikely to lead to a stable P/S over the longer term, which could set up shareholders for future disappointment. There's potential for the P/S to fall to even lower levels if the company doesn't improve its top-line growth.
What Does Shanghai XNG Holdings' P/S Mean For Investors?
Despite Shanghai XNG Holdings' share price climbing recently, its P/S still lags most other companies. It's argued the price-to-sales ratio is an inferior measure of value within certain industries, but it can be a powerful business sentiment indicator.
Our examination of Shanghai XNG Holdings confirms that the company's shrinking revenue over the past medium-term is a key factor in its low price-to-sales ratio, given the industry is projected to grow. At this stage investors feel the potential for an improvement in revenue isn't great enough to justify a higher P/S ratio. If recent medium-term revenue trends continue, it's hard to see the share price moving strongly in either direction in the near future under these circumstances.
Having said that, be aware Shanghai XNG Holdings is showing 3 warning signs in our investment analysis, and 2 of those make us uncomfortable.
Of course, profitable companies with a history of great earnings growth are generally safer bets. So you may wish to see this free collection of other companies that have reasonable P/E ratios and have grown earnings strongly.
New: Manage All Your Stock Portfolios in One Place
We've created the ultimate portfolio companion for stock investors, and it's free.
• Connect an unlimited number of Portfolios and see your total in one currency
• Be alerted to new Warning Signs or Risks via email or mobile
• Track the Fair Value of your stocks
Have feedback on this article? Concerned about the content? Get in touch with us directly. Alternatively, email editorial-team (at) simplywallst.com.
This article by Simply Wall St is general in nature. We provide commentary based on historical data and analyst forecasts only using an unbiased methodology and our articles are not intended to be financial advice. It does not constitute a recommendation to buy or sell any stock, and does not take account of your objectives, or your financial situation. We aim to bring you long-term focused analysis driven by fundamental data. Note that our analysis may not factor in the latest price-sensitive company announcements or qualitative material. Simply Wall St has no position in any stocks mentioned.
About SEHK:3666
Shanghai XNG Holdings
An investment holding company, operates a chain of restaurants in the People’s Republic of China and Hong Kong.
Slight risk and fair value.
Market Insights

Advertisement
Community Narratives
MINISO's fair value is projected at 26.69 with an anticipated PE ratio shift of 20x
Fair Value US$24.03|11.0% undervalued
BE
Community Contributor
Procter & Gamble: A Dividend Giant Facing Slowing Growth
Fair Value US$119.81|23.3% overvalued
AN
Community Contributor
Eli Lilly's Future Growth Driven by Tirzepatide and Favorable Market Conditions
Fair Value US$1.19k|13.8% undervalued
EA
Community Contributor